Albanian vs Immigrants from Cambodia Unemployment
COMPARE
Albanian
Immigrants from Cambodia
Unemployment
Unemployment Comparison
Albanians
Immigrants from Cambodia
5.3%
UNEMPLOYMENT
43.5/ 100
METRIC RATING
181st/ 347
METRIC RANK
5.5%
UNEMPLOYMENT
3.3/ 100
METRIC RATING
236th/ 347
METRIC RANK
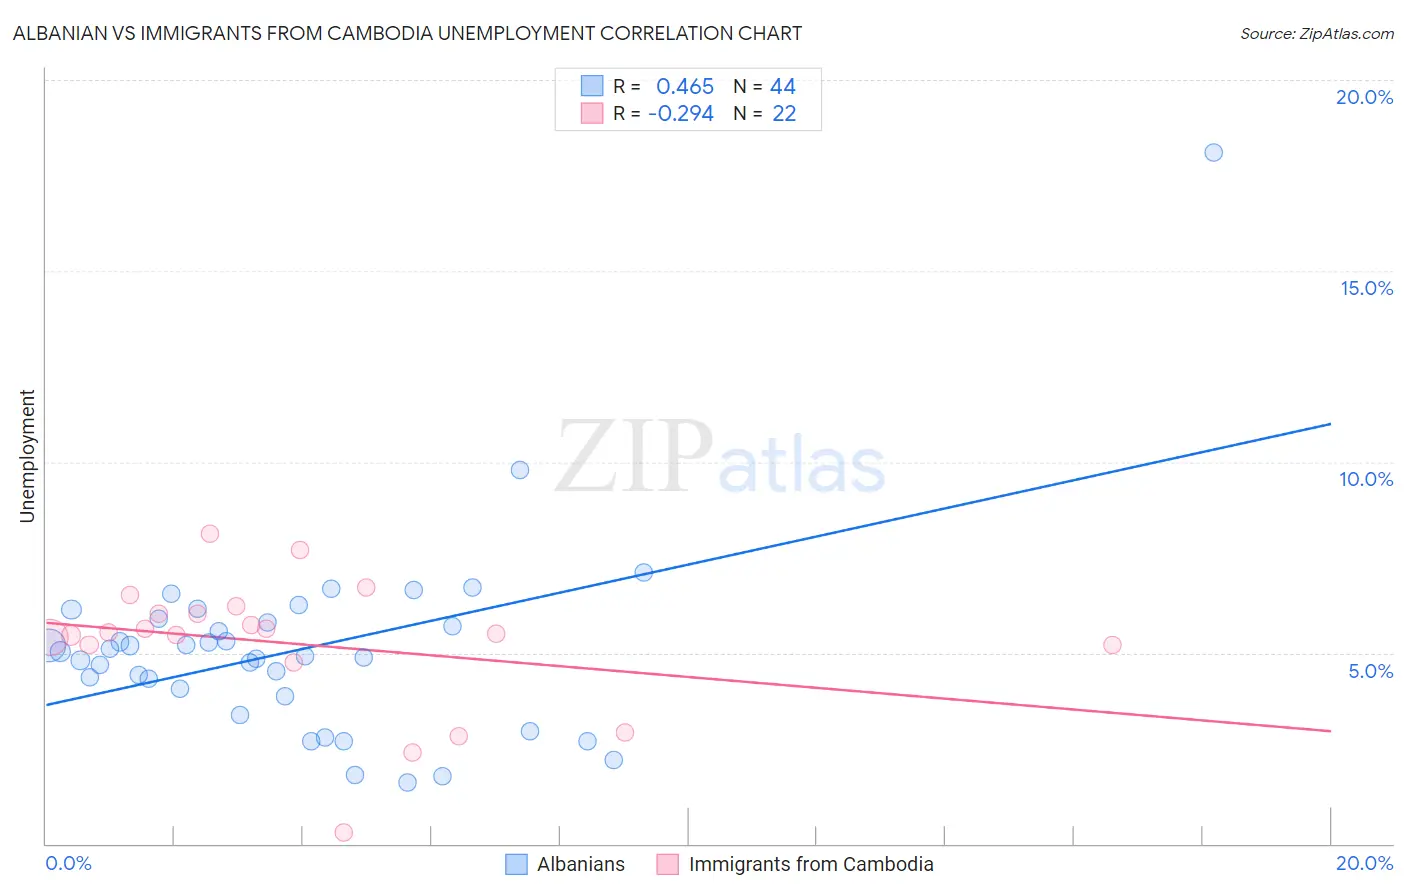
Albanian vs Immigrants from Cambodia Unemployment Correlation Chart
The statistical analysis conducted on geographies consisting of 193,192,557 people shows a moderate positive correlation between the proportion of Albanians and unemployment in the United States with a correlation coefficient (R) of 0.465 and weighted average of 5.3%. Similarly, the statistical analysis conducted on geographies consisting of 205,100,731 people shows a weak negative correlation between the proportion of Immigrants from Cambodia and unemployment in the United States with a correlation coefficient (R) of -0.294 and weighted average of 5.5%, a difference of 4.8%.
Unemployment Correlation Summary
| Measurement | Albanian | Immigrants from Cambodia |
| Minimum | 1.6% | 0.30% |
| Maximum | 18.1% | 8.1% |
| Range | 16.5% | 7.8% |
| Mean | 5.1% | 5.2% |
| Median | 5.0% | 5.5% |
| Interquartile 25% (IQ1) | 3.9% | 5.2% |
| Interquartile 75% (IQ3) | 5.8% | 6.0% |
| Interquartile Range (IQR) | 1.9% | 0.83% |
| Standard Deviation (Sample) | 2.6% | 1.8% |
| Standard Deviation (Population) | 2.6% | 1.7% |
Similar Demographics by Unemployment
Demographics Similar to Albanians by Unemployment
In terms of unemployment, the demographic groups most similar to Albanians are Spaniard (5.3%, a difference of 0.080%), Immigrants from Greece (5.3%, a difference of 0.090%), Malaysian (5.3%, a difference of 0.21%), Brazilian (5.3%, a difference of 0.21%), and Afghan (5.3%, a difference of 0.24%).
| Demographics | Rating | Rank | Unemployment |
| Immigrants | Congo | 50.0 /100 | #174 | Average 5.3% |
| Taiwanese | 49.6 /100 | #175 | Average 5.3% |
| Nicaraguans | 48.7 /100 | #176 | Average 5.3% |
| Immigrants | Nonimmigrants | 47.9 /100 | #177 | Average 5.3% |
| Afghans | 47.4 /100 | #178 | Average 5.3% |
| Malaysians | 46.8 /100 | #179 | Average 5.3% |
| Immigrants | Greece | 45.0 /100 | #180 | Average 5.3% |
| Albanians | 43.5 /100 | #181 | Average 5.3% |
| Spaniards | 42.2 /100 | #182 | Average 5.3% |
| Brazilians | 40.2 /100 | #183 | Average 5.3% |
| Assyrians/Chaldeans/Syriacs | 39.2 /100 | #184 | Fair 5.3% |
| Immigrants | Thailand | 38.9 /100 | #185 | Fair 5.3% |
| Immigrants | Uganda | 37.8 /100 | #186 | Fair 5.3% |
| Costa Ricans | 37.4 /100 | #187 | Fair 5.3% |
| Alsatians | 37.0 /100 | #188 | Fair 5.3% |
Demographics Similar to Immigrants from Cambodia by Unemployment
In terms of unemployment, the demographic groups most similar to Immigrants from Cambodia are Immigrants from Panama (5.5%, a difference of 0.030%), Moroccan (5.5%, a difference of 0.060%), Immigrants from Western Asia (5.5%, a difference of 0.27%), Immigrants (5.5%, a difference of 0.36%), and Cree (5.6%, a difference of 0.37%).
| Demographics | Rating | Rank | Unemployment |
| Hawaiians | 5.4 /100 | #229 | Tragic 5.5% |
| Ottawa | 5.4 /100 | #230 | Tragic 5.5% |
| Immigrants | Africa | 4.9 /100 | #231 | Tragic 5.5% |
| Comanche | 4.9 /100 | #232 | Tragic 5.5% |
| Immigrants | Syria | 4.8 /100 | #233 | Tragic 5.5% |
| Panamanians | 4.7 /100 | #234 | Tragic 5.5% |
| Immigrants | Panama | 3.4 /100 | #235 | Tragic 5.5% |
| Immigrants | Cambodia | 3.3 /100 | #236 | Tragic 5.5% |
| Moroccans | 3.2 /100 | #237 | Tragic 5.5% |
| Immigrants | Western Asia | 2.8 /100 | #238 | Tragic 5.5% |
| Immigrants | Immigrants | 2.6 /100 | #239 | Tragic 5.5% |
| Cree | 2.6 /100 | #240 | Tragic 5.6% |
| Tlingit-Haida | 2.0 /100 | #241 | Tragic 5.6% |
| Spanish Americans | 2.0 /100 | #242 | Tragic 5.6% |
| Marshallese | 1.3 /100 | #243 | Tragic 5.6% |