Barbadian vs Immigrants from Cambodia Ambulatory Disability
COMPARE
Barbadian
Immigrants from Cambodia
Ambulatory Disability
Ambulatory Disability Comparison
Barbadians
Immigrants from Cambodia
6.8%
AMBULATORY DISABILITY
0.0/ 100
METRIC RATING
282nd/ 347
METRIC RANK
6.2%
AMBULATORY DISABILITY
21.5/ 100
METRIC RATING
200th/ 347
METRIC RANK
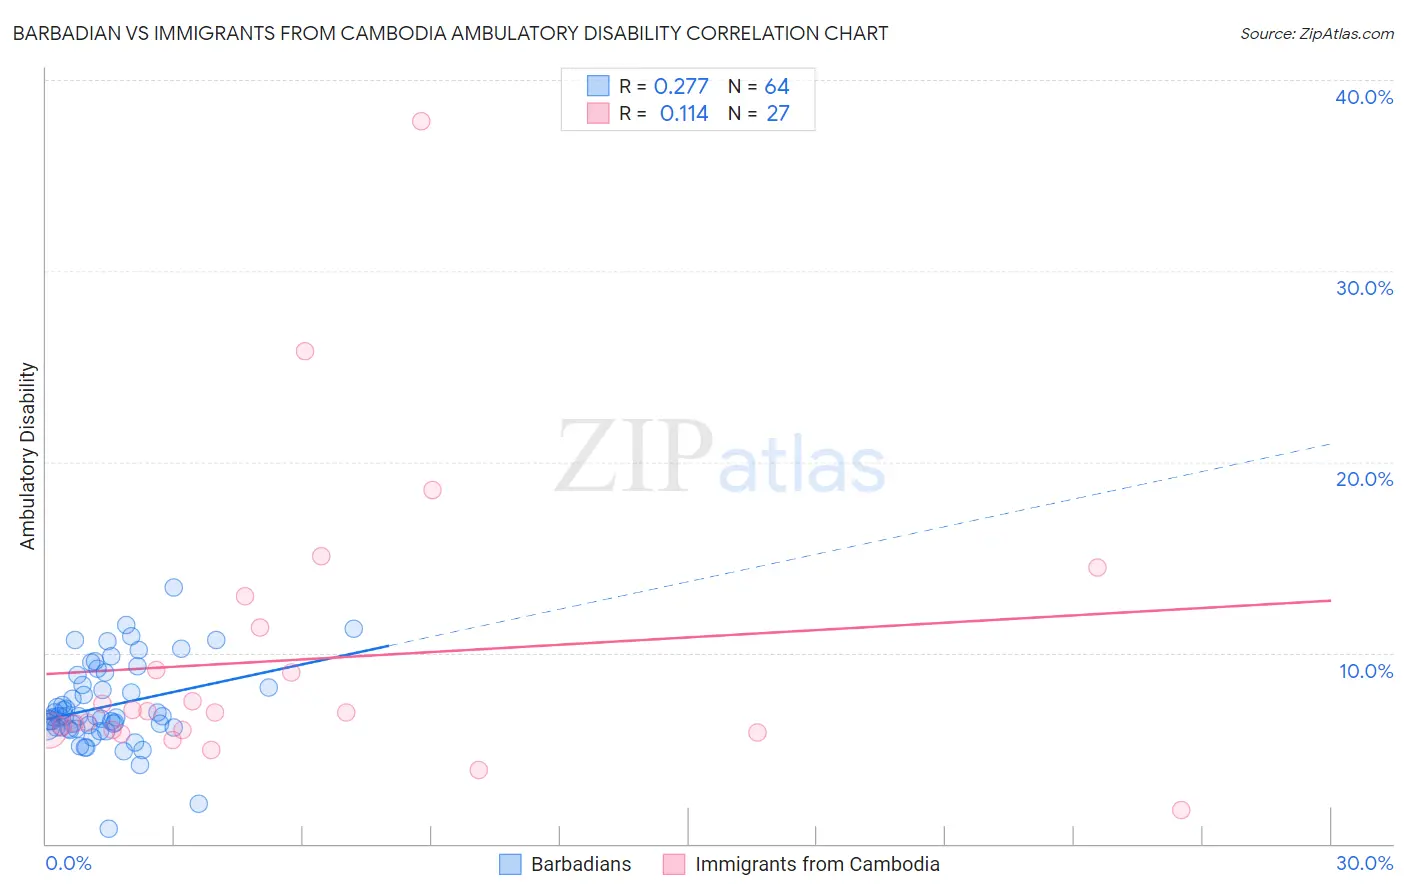
Barbadian vs Immigrants from Cambodia Ambulatory Disability Correlation Chart
The statistical analysis conducted on geographies consisting of 141,286,079 people shows a weak positive correlation between the proportion of Barbadians and percentage of population with ambulatory disability in the United States with a correlation coefficient (R) of 0.277 and weighted average of 6.8%. Similarly, the statistical analysis conducted on geographies consisting of 205,130,824 people shows a poor positive correlation between the proportion of Immigrants from Cambodia and percentage of population with ambulatory disability in the United States with a correlation coefficient (R) of 0.114 and weighted average of 6.2%, a difference of 8.7%.
Ambulatory Disability Correlation Summary
| Measurement | Barbadian | Immigrants from Cambodia |
| Minimum | 0.77% | 1.8% |
| Maximum | 13.4% | 37.9% |
| Range | 12.7% | 36.1% |
| Mean | 7.2% | 9.7% |
| Median | 6.7% | 6.9% |
| Interquartile 25% (IQ1) | 6.1% | 5.9% |
| Interquartile 75% (IQ3) | 8.6% | 11.3% |
| Interquartile Range (IQR) | 2.5% | 5.4% |
| Standard Deviation (Sample) | 2.2% | 7.6% |
| Standard Deviation (Population) | 2.2% | 7.4% |
Similar Demographics by Ambulatory Disability
Demographics Similar to Barbadians by Ambulatory Disability
In terms of ambulatory disability, the demographic groups most similar to Barbadians are Yaqui (6.8%, a difference of 0.13%), Immigrants from Barbados (6.8%, a difference of 0.16%), Pennsylvania German (6.8%, a difference of 0.20%), Immigrants from Jamaica (6.8%, a difference of 0.23%), and Immigrants from Caribbean (6.7%, a difference of 0.30%).
| Demographics | Rating | Rank | Ambulatory Disability |
| Immigrants | Guyana | 0.1 /100 | #275 | Tragic 6.7% |
| Celtics | 0.1 /100 | #276 | Tragic 6.7% |
| Jamaicans | 0.1 /100 | #277 | Tragic 6.7% |
| Immigrants | West Indies | 0.1 /100 | #278 | Tragic 6.7% |
| Immigrants | Caribbean | 0.0 /100 | #279 | Tragic 6.7% |
| Pennsylvania Germans | 0.0 /100 | #280 | Tragic 6.8% |
| Yaqui | 0.0 /100 | #281 | Tragic 6.8% |
| Barbadians | 0.0 /100 | #282 | Tragic 6.8% |
| Immigrants | Barbados | 0.0 /100 | #283 | Tragic 6.8% |
| Immigrants | Jamaica | 0.0 /100 | #284 | Tragic 6.8% |
| Fijians | 0.0 /100 | #285 | Tragic 6.8% |
| Yakama | 0.0 /100 | #286 | Tragic 6.8% |
| U.S. Virgin Islanders | 0.0 /100 | #287 | Tragic 6.8% |
| Immigrants | Nonimmigrants | 0.0 /100 | #288 | Tragic 6.9% |
| Immigrants | Dominica | 0.0 /100 | #289 | Tragic 6.9% |
Demographics Similar to Immigrants from Cambodia by Ambulatory Disability
In terms of ambulatory disability, the demographic groups most similar to Immigrants from Cambodia are Italian (6.2%, a difference of 0.080%), Immigrants from Central America (6.2%, a difference of 0.11%), Albanian (6.2%, a difference of 0.14%), Immigrants from Bangladesh (6.2%, a difference of 0.22%), and Immigrants from Ukraine (6.2%, a difference of 0.25%).
| Demographics | Rating | Rank | Ambulatory Disability |
| Guatemalans | 30.0 /100 | #193 | Fair 6.2% |
| Alaska Natives | 29.8 /100 | #194 | Fair 6.2% |
| Belgians | 28.6 /100 | #195 | Fair 6.2% |
| Malaysians | 28.2 /100 | #196 | Fair 6.2% |
| Poles | 26.3 /100 | #197 | Fair 6.2% |
| Immigrants | Bangladesh | 24.6 /100 | #198 | Fair 6.2% |
| Italians | 22.6 /100 | #199 | Fair 6.2% |
| Immigrants | Cambodia | 21.5 /100 | #200 | Fair 6.2% |
| Immigrants | Central America | 20.1 /100 | #201 | Fair 6.2% |
| Albanians | 19.7 /100 | #202 | Poor 6.2% |
| Immigrants | Ukraine | 18.4 /100 | #203 | Poor 6.2% |
| Immigrants | Congo | 18.2 /100 | #204 | Poor 6.2% |
| Slovenes | 18.0 /100 | #205 | Poor 6.2% |
| Finns | 17.2 /100 | #206 | Poor 6.2% |
| Alsatians | 15.1 /100 | #207 | Poor 6.3% |