Swiss vs Immigrants from Cambodia Unemployment
COMPARE
Swiss
Immigrants from Cambodia
Unemployment
Unemployment Comparison
Swiss
Immigrants from Cambodia
4.5%
UNEMPLOYMENT
100.0/ 100
METRIC RATING
8th/ 347
METRIC RANK
5.5%
UNEMPLOYMENT
3.3/ 100
METRIC RATING
236th/ 347
METRIC RANK
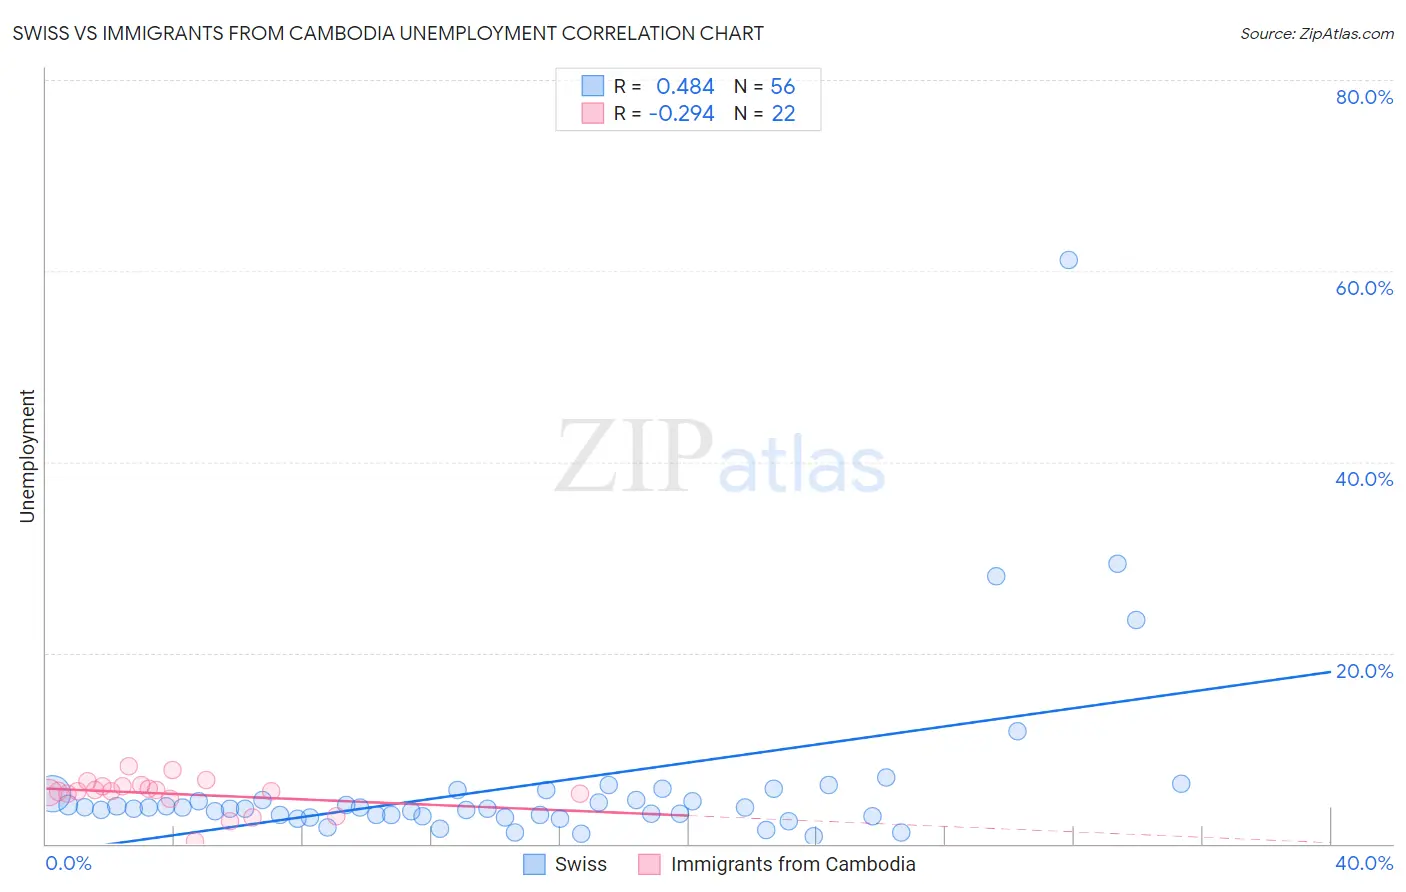
Swiss vs Immigrants from Cambodia Unemployment Correlation Chart
The statistical analysis conducted on geographies consisting of 463,573,695 people shows a moderate positive correlation between the proportion of Swiss and unemployment in the United States with a correlation coefficient (R) of 0.484 and weighted average of 4.5%. Similarly, the statistical analysis conducted on geographies consisting of 205,100,731 people shows a weak negative correlation between the proportion of Immigrants from Cambodia and unemployment in the United States with a correlation coefficient (R) of -0.294 and weighted average of 5.5%, a difference of 22.1%.
Unemployment Correlation Summary
| Measurement | Swiss | Immigrants from Cambodia |
| Minimum | 0.84% | 0.30% |
| Maximum | 61.1% | 8.1% |
| Range | 60.3% | 7.8% |
| Mean | 6.1% | 5.2% |
| Median | 3.7% | 5.5% |
| Interquartile 25% (IQ1) | 2.9% | 5.2% |
| Interquartile 75% (IQ3) | 4.9% | 6.0% |
| Interquartile Range (IQR) | 1.9% | 0.83% |
| Standard Deviation (Sample) | 9.3% | 1.8% |
| Standard Deviation (Population) | 9.2% | 1.7% |
Similar Demographics by Unemployment
Demographics Similar to Swiss by Unemployment
In terms of unemployment, the demographic groups most similar to Swiss are Scandinavian (4.5%, a difference of 0.39%), Immigrants from India (4.5%, a difference of 0.46%), Dutch (4.6%, a difference of 0.90%), German (4.5%, a difference of 1.0%), and English (4.6%, a difference of 1.6%).
| Demographics | Rating | Rank | Unemployment |
| Norwegians | 100.0 /100 | #1 | Exceptional 4.2% |
| Luxembourgers | 100.0 /100 | #2 | Exceptional 4.3% |
| Czechs | 100.0 /100 | #3 | Exceptional 4.3% |
| Danes | 100.0 /100 | #4 | Exceptional 4.3% |
| Swedes | 100.0 /100 | #5 | Exceptional 4.4% |
| Germans | 100.0 /100 | #6 | Exceptional 4.5% |
| Immigrants | India | 100.0 /100 | #7 | Exceptional 4.5% |
| Swiss | 100.0 /100 | #8 | Exceptional 4.5% |
| Scandinavians | 100.0 /100 | #9 | Exceptional 4.5% |
| Dutch | 100.0 /100 | #10 | Exceptional 4.6% |
| English | 100.0 /100 | #11 | Exceptional 4.6% |
| Pennsylvania Germans | 100.0 /100 | #12 | Exceptional 4.6% |
| Belgians | 100.0 /100 | #13 | Exceptional 4.6% |
| Immigrants | Cuba | 100.0 /100 | #14 | Exceptional 4.6% |
| Europeans | 99.9 /100 | #15 | Exceptional 4.6% |
Demographics Similar to Immigrants from Cambodia by Unemployment
In terms of unemployment, the demographic groups most similar to Immigrants from Cambodia are Immigrants from Panama (5.5%, a difference of 0.030%), Moroccan (5.5%, a difference of 0.060%), Immigrants from Western Asia (5.5%, a difference of 0.27%), Immigrants (5.5%, a difference of 0.36%), and Cree (5.6%, a difference of 0.37%).
| Demographics | Rating | Rank | Unemployment |
| Hawaiians | 5.4 /100 | #229 | Tragic 5.5% |
| Ottawa | 5.4 /100 | #230 | Tragic 5.5% |
| Immigrants | Africa | 4.9 /100 | #231 | Tragic 5.5% |
| Comanche | 4.9 /100 | #232 | Tragic 5.5% |
| Immigrants | Syria | 4.8 /100 | #233 | Tragic 5.5% |
| Panamanians | 4.7 /100 | #234 | Tragic 5.5% |
| Immigrants | Panama | 3.4 /100 | #235 | Tragic 5.5% |
| Immigrants | Cambodia | 3.3 /100 | #236 | Tragic 5.5% |
| Moroccans | 3.2 /100 | #237 | Tragic 5.5% |
| Immigrants | Western Asia | 2.8 /100 | #238 | Tragic 5.5% |
| Immigrants | Immigrants | 2.6 /100 | #239 | Tragic 5.5% |
| Cree | 2.6 /100 | #240 | Tragic 5.6% |
| Tlingit-Haida | 2.0 /100 | #241 | Tragic 5.6% |
| Spanish Americans | 2.0 /100 | #242 | Tragic 5.6% |
| Marshallese | 1.3 /100 | #243 | Tragic 5.6% |