Armenian vs Sioux Male Unemployment
COMPARE
Armenian
Sioux
Male Unemployment
Male Unemployment Comparison
Armenians
Sioux
6.0%
MALE UNEMPLOYMENT
0.0/ 100
METRIC RATING
273rd/ 347
METRIC RANK
8.4%
MALE UNEMPLOYMENT
0.0/ 100
METRIC RATING
333rd/ 347
METRIC RANK
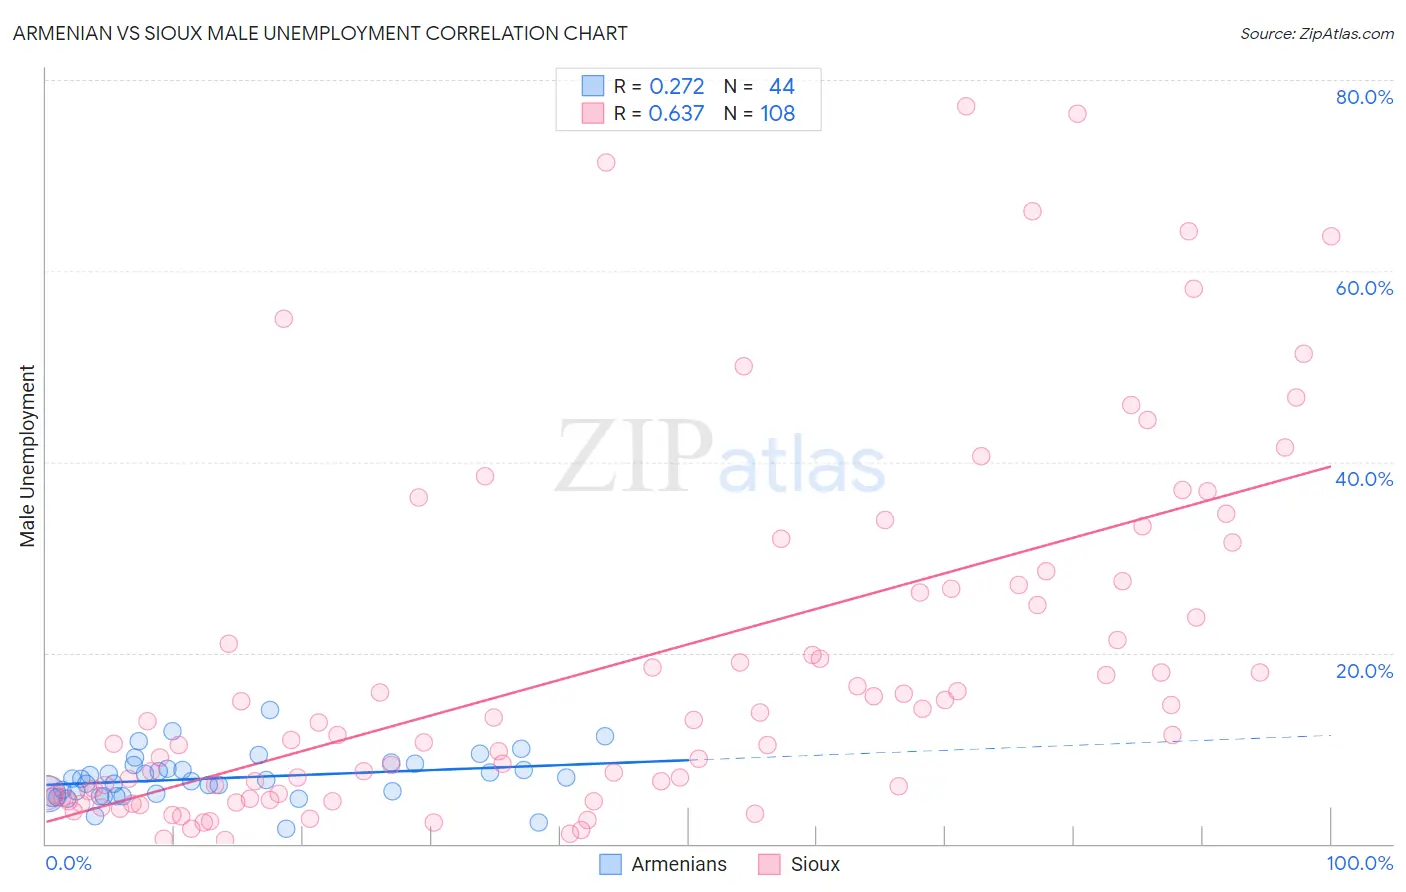
Armenian vs Sioux Male Unemployment Correlation Chart
The statistical analysis conducted on geographies consisting of 310,068,401 people shows a weak positive correlation between the proportion of Armenians and unemployment rate among males in the United States with a correlation coefficient (R) of 0.272 and weighted average of 6.0%. Similarly, the statistical analysis conducted on geographies consisting of 232,900,714 people shows a significant positive correlation between the proportion of Sioux and unemployment rate among males in the United States with a correlation coefficient (R) of 0.637 and weighted average of 8.4%, a difference of 39.6%.
Male Unemployment Correlation Summary
| Measurement | Armenian | Sioux |
| Minimum | 1.6% | 0.40% |
| Maximum | 14.0% | 77.3% |
| Range | 12.4% | 76.9% |
| Mean | 6.9% | 18.8% |
| Median | 6.8% | 12.1% |
| Interquartile 25% (IQ1) | 5.1% | 5.1% |
| Interquartile 75% (IQ3) | 8.0% | 26.9% |
| Interquartile Range (IQR) | 2.9% | 21.8% |
| Standard Deviation (Sample) | 2.4% | 18.6% |
| Standard Deviation (Population) | 2.4% | 18.5% |
Similar Demographics by Male Unemployment
Demographics Similar to Armenians by Male Unemployment
In terms of male unemployment, the demographic groups most similar to Armenians are Immigrants from Uzbekistan (6.0%, a difference of 0.010%), Immigrants from Sierra Leone (6.0%, a difference of 0.17%), Blackfeet (6.0%, a difference of 0.24%), Menominee (6.0%, a difference of 0.33%), and Tlingit-Haida (6.0%, a difference of 0.43%).
| Demographics | Rating | Rank | Male Unemployment |
| Bahamians | 0.0 /100 | #266 | Tragic 5.9% |
| Nigerians | 0.0 /100 | #267 | Tragic 5.9% |
| Bermudans | 0.0 /100 | #268 | Tragic 5.9% |
| Immigrants | Nigeria | 0.0 /100 | #269 | Tragic 6.0% |
| Sub-Saharan Africans | 0.0 /100 | #270 | Tragic 6.0% |
| Blackfeet | 0.0 /100 | #271 | Tragic 6.0% |
| Immigrants | Uzbekistan | 0.0 /100 | #272 | Tragic 6.0% |
| Armenians | 0.0 /100 | #273 | Tragic 6.0% |
| Immigrants | Sierra Leone | 0.0 /100 | #274 | Tragic 6.0% |
| Menominee | 0.0 /100 | #275 | Tragic 6.0% |
| Tlingit-Haida | 0.0 /100 | #276 | Tragic 6.0% |
| Immigrants | Liberia | 0.0 /100 | #277 | Tragic 6.1% |
| Immigrants | Fiji | 0.0 /100 | #278 | Tragic 6.1% |
| Ghanaians | 0.0 /100 | #279 | Tragic 6.1% |
| Immigrants | Ghana | 0.0 /100 | #280 | Tragic 6.2% |
Demographics Similar to Sioux by Male Unemployment
In terms of male unemployment, the demographic groups most similar to Sioux are Tsimshian (8.5%, a difference of 0.97%), Pueblo (8.5%, a difference of 1.0%), Pima (8.3%, a difference of 1.3%), Yuman (8.6%, a difference of 2.4%), and Puerto Rican (8.6%, a difference of 2.5%).
| Demographics | Rating | Rank | Male Unemployment |
| Immigrants | Dominican Republic | 0.0 /100 | #326 | Tragic 7.6% |
| Paiute | 0.0 /100 | #327 | Tragic 7.7% |
| Natives/Alaskans | 0.0 /100 | #328 | Tragic 7.7% |
| Immigrants | Yemen | 0.0 /100 | #329 | Tragic 7.8% |
| Yakama | 0.0 /100 | #330 | Tragic 7.9% |
| Alaska Natives | 0.0 /100 | #331 | Tragic 8.1% |
| Pima | 0.0 /100 | #332 | Tragic 8.3% |
| Sioux | 0.0 /100 | #333 | Tragic 8.4% |
| Tsimshian | 0.0 /100 | #334 | Tragic 8.5% |
| Pueblo | 0.0 /100 | #335 | Tragic 8.5% |
| Yuman | 0.0 /100 | #336 | Tragic 8.6% |
| Puerto Ricans | 0.0 /100 | #337 | Tragic 8.6% |
| Apache | 0.0 /100 | #338 | Tragic 8.6% |
| Cheyenne | 0.0 /100 | #339 | Tragic 9.8% |
| Alaskan Athabascans | 0.0 /100 | #340 | Tragic 9.8% |