Immigrants from Albania vs Sioux Male Unemployment
COMPARE
Immigrants from Albania
Sioux
Male Unemployment
Male Unemployment Comparison
Immigrants from Albania
Sioux
5.5%
MALE UNEMPLOYMENT
3.6/ 100
METRIC RATING
218th/ 347
METRIC RANK
8.4%
MALE UNEMPLOYMENT
0.0/ 100
METRIC RATING
333rd/ 347
METRIC RANK
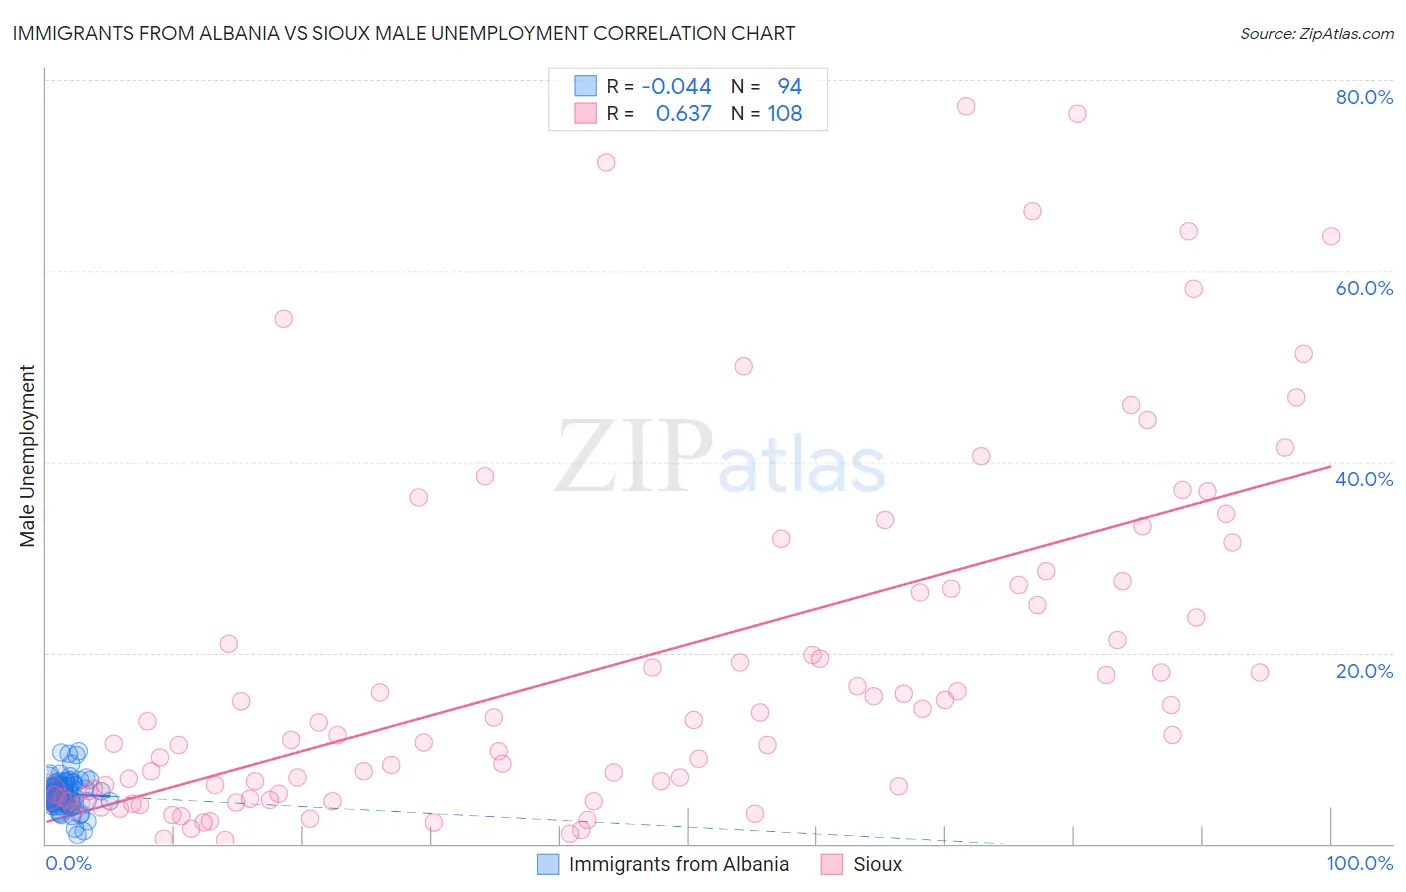
Immigrants from Albania vs Sioux Male Unemployment Correlation Chart
The statistical analysis conducted on geographies consisting of 119,319,366 people shows no correlation between the proportion of Immigrants from Albania and unemployment rate among males in the United States with a correlation coefficient (R) of -0.044 and weighted average of 5.5%. Similarly, the statistical analysis conducted on geographies consisting of 232,900,714 people shows a significant positive correlation between the proportion of Sioux and unemployment rate among males in the United States with a correlation coefficient (R) of 0.637 and weighted average of 8.4%, a difference of 51.1%.
Male Unemployment Correlation Summary
| Measurement | Immigrants from Albania | Sioux |
| Minimum | 0.90% | 0.40% |
| Maximum | 9.7% | 77.3% |
| Range | 8.8% | 76.9% |
| Mean | 5.2% | 18.8% |
| Median | 5.1% | 12.1% |
| Interquartile 25% (IQ1) | 4.3% | 5.1% |
| Interquartile 75% (IQ3) | 6.1% | 26.9% |
| Interquartile Range (IQR) | 1.8% | 21.8% |
| Standard Deviation (Sample) | 1.6% | 18.6% |
| Standard Deviation (Population) | 1.6% | 18.5% |
Similar Demographics by Male Unemployment
Demographics Similar to Immigrants from Albania by Male Unemployment
In terms of male unemployment, the demographic groups most similar to Immigrants from Albania are Immigrants from Western Asia (5.6%, a difference of 0.050%), Portuguese (5.6%, a difference of 0.070%), Soviet Union (5.6%, a difference of 0.18%), Delaware (5.5%, a difference of 0.21%), and Immigrants (5.5%, a difference of 0.26%).
| Demographics | Rating | Rank | Male Unemployment |
| Israelis | 7.4 /100 | #211 | Tragic 5.5% |
| Hmong | 7.0 /100 | #212 | Tragic 5.5% |
| Ugandans | 6.3 /100 | #213 | Tragic 5.5% |
| Puget Sound Salish | 5.6 /100 | #214 | Tragic 5.5% |
| Samoans | 4.9 /100 | #215 | Tragic 5.5% |
| Immigrants | Immigrants | 4.3 /100 | #216 | Tragic 5.5% |
| Delaware | 4.2 /100 | #217 | Tragic 5.5% |
| Immigrants | Albania | 3.6 /100 | #218 | Tragic 5.5% |
| Immigrants | Western Asia | 3.5 /100 | #219 | Tragic 5.6% |
| Portuguese | 3.5 /100 | #220 | Tragic 5.6% |
| Soviet Union | 3.2 /100 | #221 | Tragic 5.6% |
| Immigrants | Micronesia | 2.9 /100 | #222 | Tragic 5.6% |
| Creek | 2.6 /100 | #223 | Tragic 5.6% |
| Cherokee | 2.4 /100 | #224 | Tragic 5.6% |
| Panamanians | 1.9 /100 | #225 | Tragic 5.6% |
Demographics Similar to Sioux by Male Unemployment
In terms of male unemployment, the demographic groups most similar to Sioux are Tsimshian (8.5%, a difference of 0.97%), Pueblo (8.5%, a difference of 1.0%), Pima (8.3%, a difference of 1.3%), Yuman (8.6%, a difference of 2.4%), and Puerto Rican (8.6%, a difference of 2.5%).
| Demographics | Rating | Rank | Male Unemployment |
| Immigrants | Dominican Republic | 0.0 /100 | #326 | Tragic 7.6% |
| Paiute | 0.0 /100 | #327 | Tragic 7.7% |
| Natives/Alaskans | 0.0 /100 | #328 | Tragic 7.7% |
| Immigrants | Yemen | 0.0 /100 | #329 | Tragic 7.8% |
| Yakama | 0.0 /100 | #330 | Tragic 7.9% |
| Alaska Natives | 0.0 /100 | #331 | Tragic 8.1% |
| Pima | 0.0 /100 | #332 | Tragic 8.3% |
| Sioux | 0.0 /100 | #333 | Tragic 8.4% |
| Tsimshian | 0.0 /100 | #334 | Tragic 8.5% |
| Pueblo | 0.0 /100 | #335 | Tragic 8.5% |
| Yuman | 0.0 /100 | #336 | Tragic 8.6% |
| Puerto Ricans | 0.0 /100 | #337 | Tragic 8.6% |
| Apache | 0.0 /100 | #338 | Tragic 8.6% |
| Cheyenne | 0.0 /100 | #339 | Tragic 9.8% |
| Alaskan Athabascans | 0.0 /100 | #340 | Tragic 9.8% |