Armenian vs Mexican Male Unemployment
COMPARE
Armenian
Mexican
Male Unemployment
Male Unemployment Comparison
Armenians
Mexicans
6.0%
MALE UNEMPLOYMENT
0.0/ 100
METRIC RATING
273rd/ 347
METRIC RANK
5.8%
MALE UNEMPLOYMENT
0.2/ 100
METRIC RATING
252nd/ 347
METRIC RANK
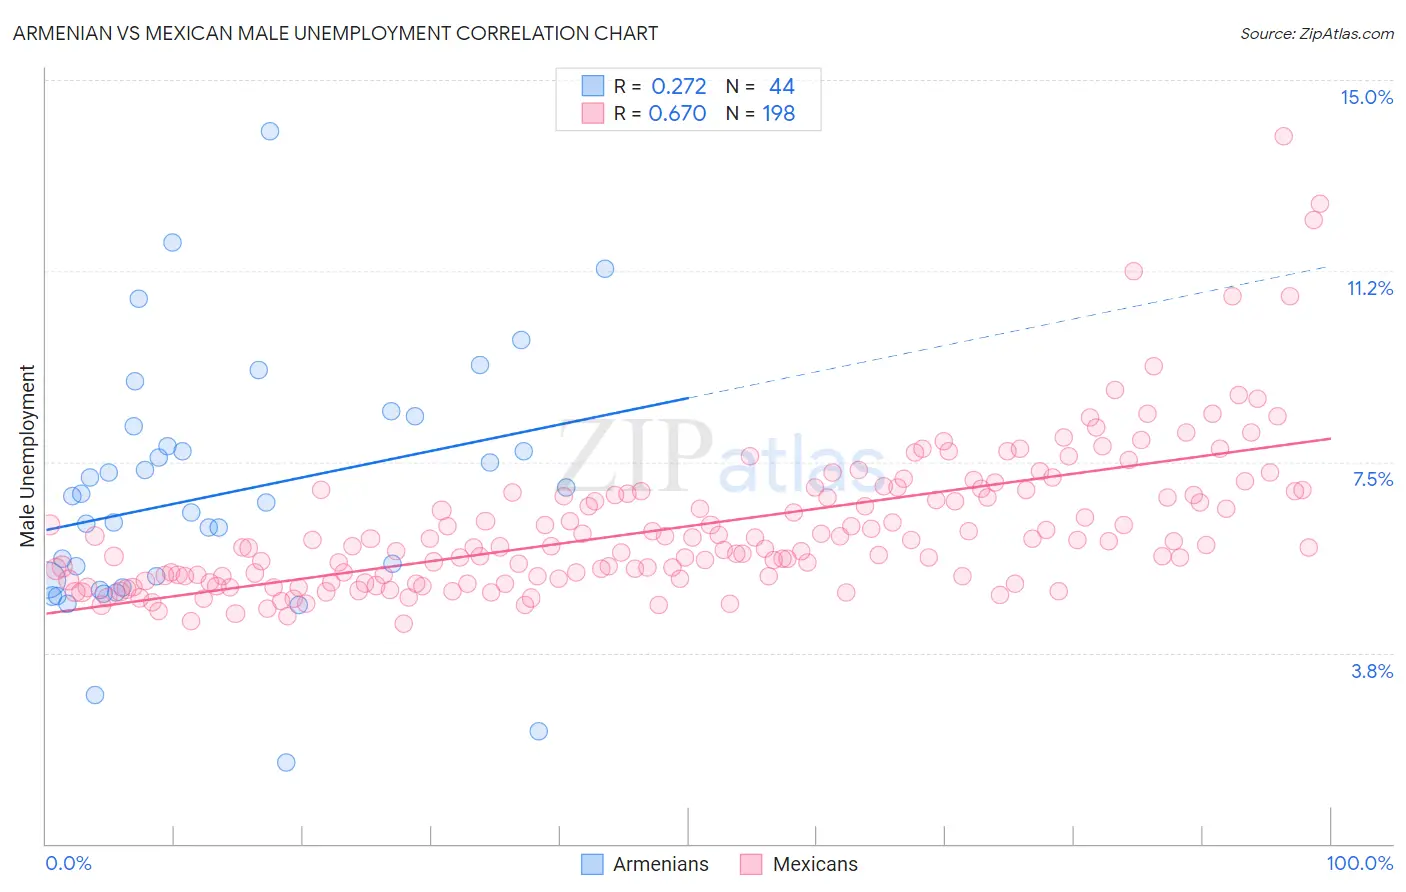
Armenian vs Mexican Male Unemployment Correlation Chart
The statistical analysis conducted on geographies consisting of 310,068,401 people shows a weak positive correlation between the proportion of Armenians and unemployment rate among males in the United States with a correlation coefficient (R) of 0.272 and weighted average of 6.0%. Similarly, the statistical analysis conducted on geographies consisting of 555,694,917 people shows a significant positive correlation between the proportion of Mexicans and unemployment rate among males in the United States with a correlation coefficient (R) of 0.670 and weighted average of 5.8%, a difference of 4.2%.
Male Unemployment Correlation Summary
| Measurement | Armenian | Mexican |
| Minimum | 1.6% | 4.3% |
| Maximum | 14.0% | 13.9% |
| Range | 12.4% | 9.6% |
| Mean | 6.9% | 6.2% |
| Median | 6.8% | 5.8% |
| Interquartile 25% (IQ1) | 5.1% | 5.2% |
| Interquartile 75% (IQ3) | 8.0% | 6.9% |
| Interquartile Range (IQR) | 2.9% | 1.7% |
| Standard Deviation (Sample) | 2.4% | 1.5% |
| Standard Deviation (Population) | 2.4% | 1.5% |
Similar Demographics by Male Unemployment
Demographics Similar to Armenians by Male Unemployment
In terms of male unemployment, the demographic groups most similar to Armenians are Immigrants from Uzbekistan (6.0%, a difference of 0.010%), Immigrants from Sierra Leone (6.0%, a difference of 0.17%), Blackfeet (6.0%, a difference of 0.24%), Menominee (6.0%, a difference of 0.33%), and Tlingit-Haida (6.0%, a difference of 0.43%).
| Demographics | Rating | Rank | Male Unemployment |
| Bahamians | 0.0 /100 | #266 | Tragic 5.9% |
| Nigerians | 0.0 /100 | #267 | Tragic 5.9% |
| Bermudans | 0.0 /100 | #268 | Tragic 5.9% |
| Immigrants | Nigeria | 0.0 /100 | #269 | Tragic 6.0% |
| Sub-Saharan Africans | 0.0 /100 | #270 | Tragic 6.0% |
| Blackfeet | 0.0 /100 | #271 | Tragic 6.0% |
| Immigrants | Uzbekistan | 0.0 /100 | #272 | Tragic 6.0% |
| Armenians | 0.0 /100 | #273 | Tragic 6.0% |
| Immigrants | Sierra Leone | 0.0 /100 | #274 | Tragic 6.0% |
| Menominee | 0.0 /100 | #275 | Tragic 6.0% |
| Tlingit-Haida | 0.0 /100 | #276 | Tragic 6.0% |
| Immigrants | Liberia | 0.0 /100 | #277 | Tragic 6.1% |
| Immigrants | Fiji | 0.0 /100 | #278 | Tragic 6.1% |
| Ghanaians | 0.0 /100 | #279 | Tragic 6.1% |
| Immigrants | Ghana | 0.0 /100 | #280 | Tragic 6.2% |
Demographics Similar to Mexicans by Male Unemployment
In terms of male unemployment, the demographic groups most similar to Mexicans are Mexican American Indian (5.8%, a difference of 0.13%), Japanese (5.8%, a difference of 0.30%), Kiowa (5.8%, a difference of 0.41%), Comanche (5.8%, a difference of 0.49%), and Spanish American (5.7%, a difference of 0.57%).
| Demographics | Rating | Rank | Male Unemployment |
| Yaqui | 0.7 /100 | #245 | Tragic 5.7% |
| Iroquois | 0.6 /100 | #246 | Tragic 5.7% |
| Hawaiians | 0.6 /100 | #247 | Tragic 5.7% |
| Marshallese | 0.5 /100 | #248 | Tragic 5.7% |
| Cree | 0.4 /100 | #249 | Tragic 5.7% |
| Immigrants | Bahamas | 0.4 /100 | #250 | Tragic 5.7% |
| Spanish Americans | 0.3 /100 | #251 | Tragic 5.7% |
| Mexicans | 0.2 /100 | #252 | Tragic 5.8% |
| Mexican American Indians | 0.2 /100 | #253 | Tragic 5.8% |
| Japanese | 0.2 /100 | #254 | Tragic 5.8% |
| Kiowa | 0.2 /100 | #255 | Tragic 5.8% |
| Comanche | 0.2 /100 | #256 | Tragic 5.8% |
| Hispanics or Latinos | 0.1 /100 | #257 | Tragic 5.8% |
| Dutch West Indians | 0.1 /100 | #258 | Tragic 5.8% |
| Cajuns | 0.1 /100 | #259 | Tragic 5.8% |