Immigrants from Hungary vs Sioux Male Unemployment
COMPARE
Immigrants from Hungary
Sioux
Male Unemployment
Male Unemployment Comparison
Immigrants from Hungary
Sioux
5.2%
MALE UNEMPLOYMENT
73.4/ 100
METRIC RATING
155th/ 347
METRIC RANK
8.4%
MALE UNEMPLOYMENT
0.0/ 100
METRIC RATING
333rd/ 347
METRIC RANK
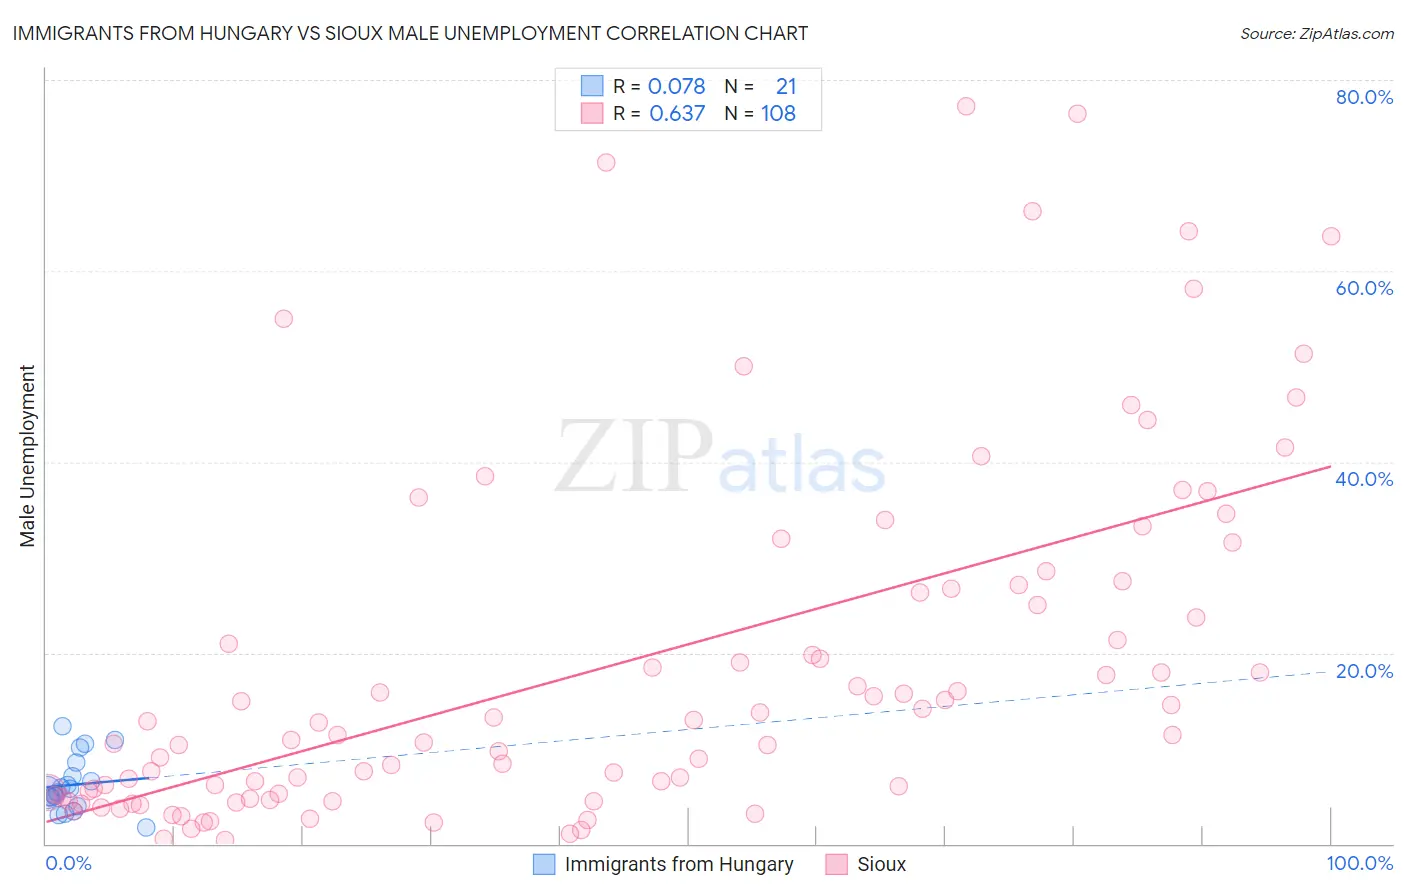
Immigrants from Hungary vs Sioux Male Unemployment Correlation Chart
The statistical analysis conducted on geographies consisting of 195,412,330 people shows a slight positive correlation between the proportion of Immigrants from Hungary and unemployment rate among males in the United States with a correlation coefficient (R) of 0.078 and weighted average of 5.2%. Similarly, the statistical analysis conducted on geographies consisting of 232,900,714 people shows a significant positive correlation between the proportion of Sioux and unemployment rate among males in the United States with a correlation coefficient (R) of 0.637 and weighted average of 8.4%, a difference of 60.7%.
Male Unemployment Correlation Summary
| Measurement | Immigrants from Hungary | Sioux |
| Minimum | 1.7% | 0.40% |
| Maximum | 12.3% | 77.3% |
| Range | 10.6% | 76.9% |
| Mean | 6.2% | 18.8% |
| Median | 5.4% | 12.1% |
| Interquartile 25% (IQ1) | 4.4% | 5.1% |
| Interquartile 75% (IQ3) | 7.8% | 26.9% |
| Interquartile Range (IQR) | 3.5% | 21.8% |
| Standard Deviation (Sample) | 2.8% | 18.6% |
| Standard Deviation (Population) | 2.8% | 18.5% |
Similar Demographics by Male Unemployment
Demographics Similar to Immigrants from Hungary by Male Unemployment
In terms of male unemployment, the demographic groups most similar to Immigrants from Hungary are Laotian (5.2%, a difference of 0.030%), Immigrants from Uruguay (5.2%, a difference of 0.040%), American (5.2%, a difference of 0.060%), Immigrants from Northern Africa (5.2%, a difference of 0.080%), and Egyptian (5.2%, a difference of 0.11%).
| Demographics | Rating | Rank | Male Unemployment |
| Immigrants | Italy | 76.3 /100 | #148 | Good 5.2% |
| Immigrants | Europe | 76.2 /100 | #149 | Good 5.2% |
| Indians (Asian) | 76.0 /100 | #150 | Good 5.2% |
| Slovaks | 75.5 /100 | #151 | Good 5.2% |
| Egyptians | 74.8 /100 | #152 | Good 5.2% |
| Immigrants | Uruguay | 73.9 /100 | #153 | Good 5.2% |
| Laotians | 73.8 /100 | #154 | Good 5.2% |
| Immigrants | Hungary | 73.4 /100 | #155 | Good 5.2% |
| Americans | 72.7 /100 | #156 | Good 5.2% |
| Immigrants | Northern Africa | 72.3 /100 | #157 | Good 5.2% |
| Immigrants | Indonesia | 71.5 /100 | #158 | Good 5.2% |
| Indonesians | 71.2 /100 | #159 | Good 5.2% |
| Immigrants | Norway | 71.0 /100 | #160 | Good 5.2% |
| Immigrants | China | 70.6 /100 | #161 | Good 5.2% |
| Immigrants | Egypt | 65.9 /100 | #162 | Good 5.2% |
Demographics Similar to Sioux by Male Unemployment
In terms of male unemployment, the demographic groups most similar to Sioux are Tsimshian (8.5%, a difference of 0.97%), Pueblo (8.5%, a difference of 1.0%), Pima (8.3%, a difference of 1.3%), Yuman (8.6%, a difference of 2.4%), and Puerto Rican (8.6%, a difference of 2.5%).
| Demographics | Rating | Rank | Male Unemployment |
| Immigrants | Dominican Republic | 0.0 /100 | #326 | Tragic 7.6% |
| Paiute | 0.0 /100 | #327 | Tragic 7.7% |
| Natives/Alaskans | 0.0 /100 | #328 | Tragic 7.7% |
| Immigrants | Yemen | 0.0 /100 | #329 | Tragic 7.8% |
| Yakama | 0.0 /100 | #330 | Tragic 7.9% |
| Alaska Natives | 0.0 /100 | #331 | Tragic 8.1% |
| Pima | 0.0 /100 | #332 | Tragic 8.3% |
| Sioux | 0.0 /100 | #333 | Tragic 8.4% |
| Tsimshian | 0.0 /100 | #334 | Tragic 8.5% |
| Pueblo | 0.0 /100 | #335 | Tragic 8.5% |
| Yuman | 0.0 /100 | #336 | Tragic 8.6% |
| Puerto Ricans | 0.0 /100 | #337 | Tragic 8.6% |
| Apache | 0.0 /100 | #338 | Tragic 8.6% |
| Cheyenne | 0.0 /100 | #339 | Tragic 9.8% |
| Alaskan Athabascans | 0.0 /100 | #340 | Tragic 9.8% |