Immigrants from Cabo Verde vs Sioux Male Unemployment
COMPARE
Immigrants from Cabo Verde
Sioux
Male Unemployment
Male Unemployment Comparison
Immigrants from Cabo Verde
Sioux
7.5%
MALE UNEMPLOYMENT
0.0/ 100
METRIC RATING
322nd/ 347
METRIC RANK
8.4%
MALE UNEMPLOYMENT
0.0/ 100
METRIC RATING
333rd/ 347
METRIC RANK
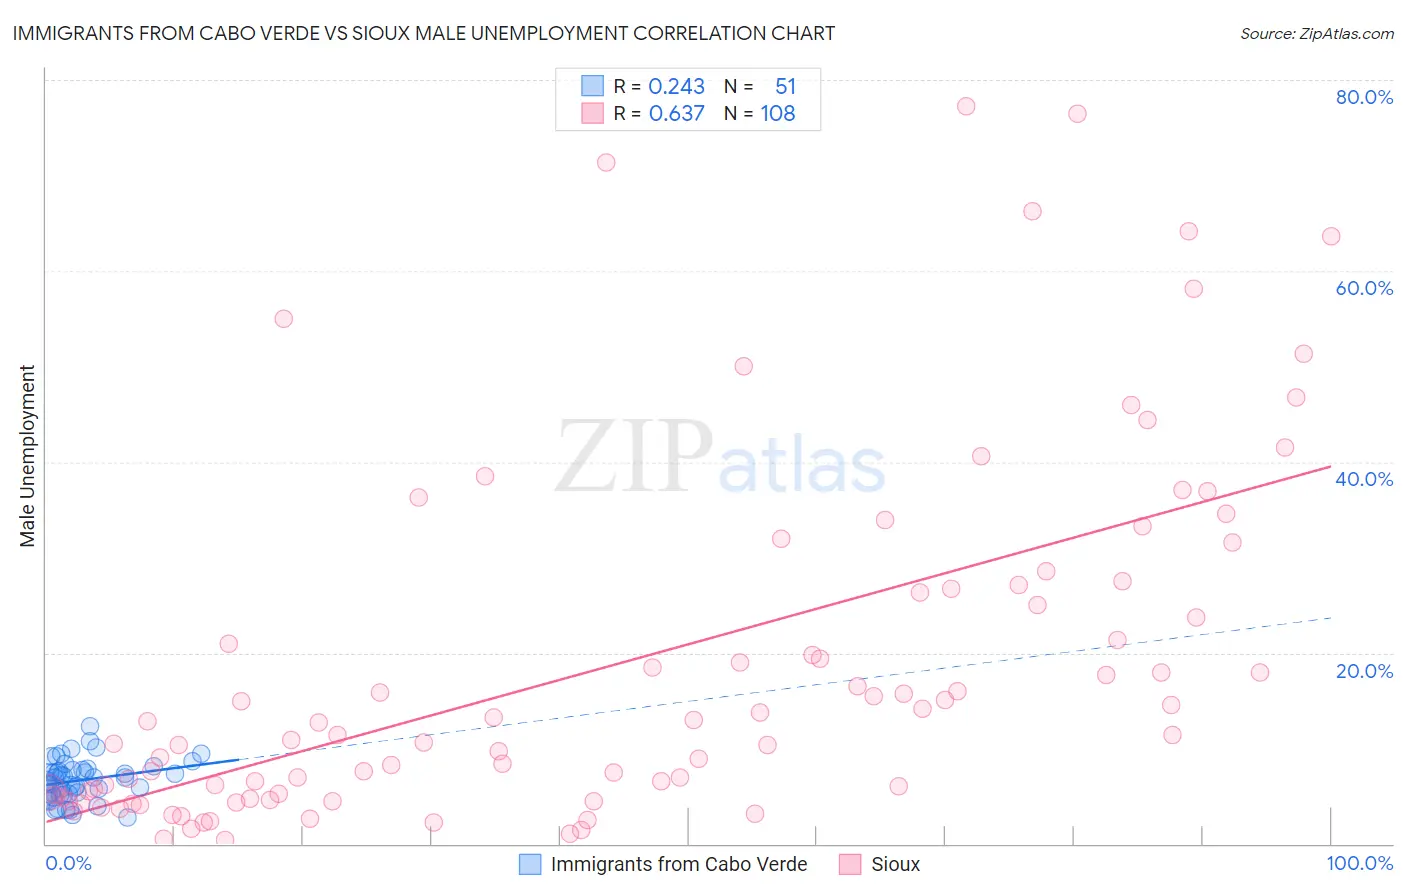
Immigrants from Cabo Verde vs Sioux Male Unemployment Correlation Chart
The statistical analysis conducted on geographies consisting of 38,125,323 people shows a weak positive correlation between the proportion of Immigrants from Cabo Verde and unemployment rate among males in the United States with a correlation coefficient (R) of 0.243 and weighted average of 7.5%. Similarly, the statistical analysis conducted on geographies consisting of 232,900,714 people shows a significant positive correlation between the proportion of Sioux and unemployment rate among males in the United States with a correlation coefficient (R) of 0.637 and weighted average of 8.4%, a difference of 11.9%.
Male Unemployment Correlation Summary
| Measurement | Immigrants from Cabo Verde | Sioux |
| Minimum | 2.8% | 0.40% |
| Maximum | 12.3% | 77.3% |
| Range | 9.5% | 76.9% |
| Mean | 6.7% | 18.8% |
| Median | 6.9% | 12.1% |
| Interquartile 25% (IQ1) | 5.2% | 5.1% |
| Interquartile 75% (IQ3) | 7.7% | 26.9% |
| Interquartile Range (IQR) | 2.5% | 21.8% |
| Standard Deviation (Sample) | 2.1% | 18.6% |
| Standard Deviation (Population) | 2.1% | 18.5% |
Demographics Similar to Immigrants from Cabo Verde and Sioux by Male Unemployment
In terms of male unemployment, the demographic groups most similar to Immigrants from Cabo Verde are Immigrants from St. Vincent and the Grenadines (7.5%, a difference of 0.33%), Immigrants from Grenada (7.6%, a difference of 0.79%), Dominican (7.6%, a difference of 1.1%), Shoshone (7.6%, a difference of 1.4%), and Immigrants from Dominican Republic (7.6%, a difference of 1.5%). Similarly, the demographic groups most similar to Sioux are Tsimshian (8.5%, a difference of 0.97%), Pueblo (8.5%, a difference of 1.0%), Pima (8.3%, a difference of 1.3%), Yuman (8.6%, a difference of 2.4%), and Puerto Rican (8.6%, a difference of 2.5%).
| Demographics | Rating | Rank | Male Unemployment |
| Guyanese | 0.0 /100 | #317 | Tragic 7.1% |
| Cape Verdeans | 0.0 /100 | #318 | Tragic 7.1% |
| British West Indians | 0.0 /100 | #319 | Tragic 7.3% |
| Colville | 0.0 /100 | #320 | Tragic 7.4% |
| Immigrants | St. Vincent and the Grenadines | 0.0 /100 | #321 | Tragic 7.5% |
| Immigrants | Cabo Verde | 0.0 /100 | #322 | Tragic 7.5% |
| Immigrants | Grenada | 0.0 /100 | #323 | Tragic 7.6% |
| Dominicans | 0.0 /100 | #324 | Tragic 7.6% |
| Shoshone | 0.0 /100 | #325 | Tragic 7.6% |
| Immigrants | Dominican Republic | 0.0 /100 | #326 | Tragic 7.6% |
| Paiute | 0.0 /100 | #327 | Tragic 7.7% |
| Natives/Alaskans | 0.0 /100 | #328 | Tragic 7.7% |
| Immigrants | Yemen | 0.0 /100 | #329 | Tragic 7.8% |
| Yakama | 0.0 /100 | #330 | Tragic 7.9% |
| Alaska Natives | 0.0 /100 | #331 | Tragic 8.1% |
| Pima | 0.0 /100 | #332 | Tragic 8.3% |
| Sioux | 0.0 /100 | #333 | Tragic 8.4% |
| Tsimshian | 0.0 /100 | #334 | Tragic 8.5% |
| Pueblo | 0.0 /100 | #335 | Tragic 8.5% |
| Yuman | 0.0 /100 | #336 | Tragic 8.6% |
| Puerto Ricans | 0.0 /100 | #337 | Tragic 8.6% |