Armenian vs Indian (Asian) Male Unemployment
COMPARE
Armenian
Indian (Asian)
Male Unemployment
Male Unemployment Comparison
Armenians
Indians (Asian)
6.0%
MALE UNEMPLOYMENT
0.0/ 100
METRIC RATING
273rd/ 347
METRIC RANK
5.2%
MALE UNEMPLOYMENT
76.0/ 100
METRIC RATING
150th/ 347
METRIC RANK
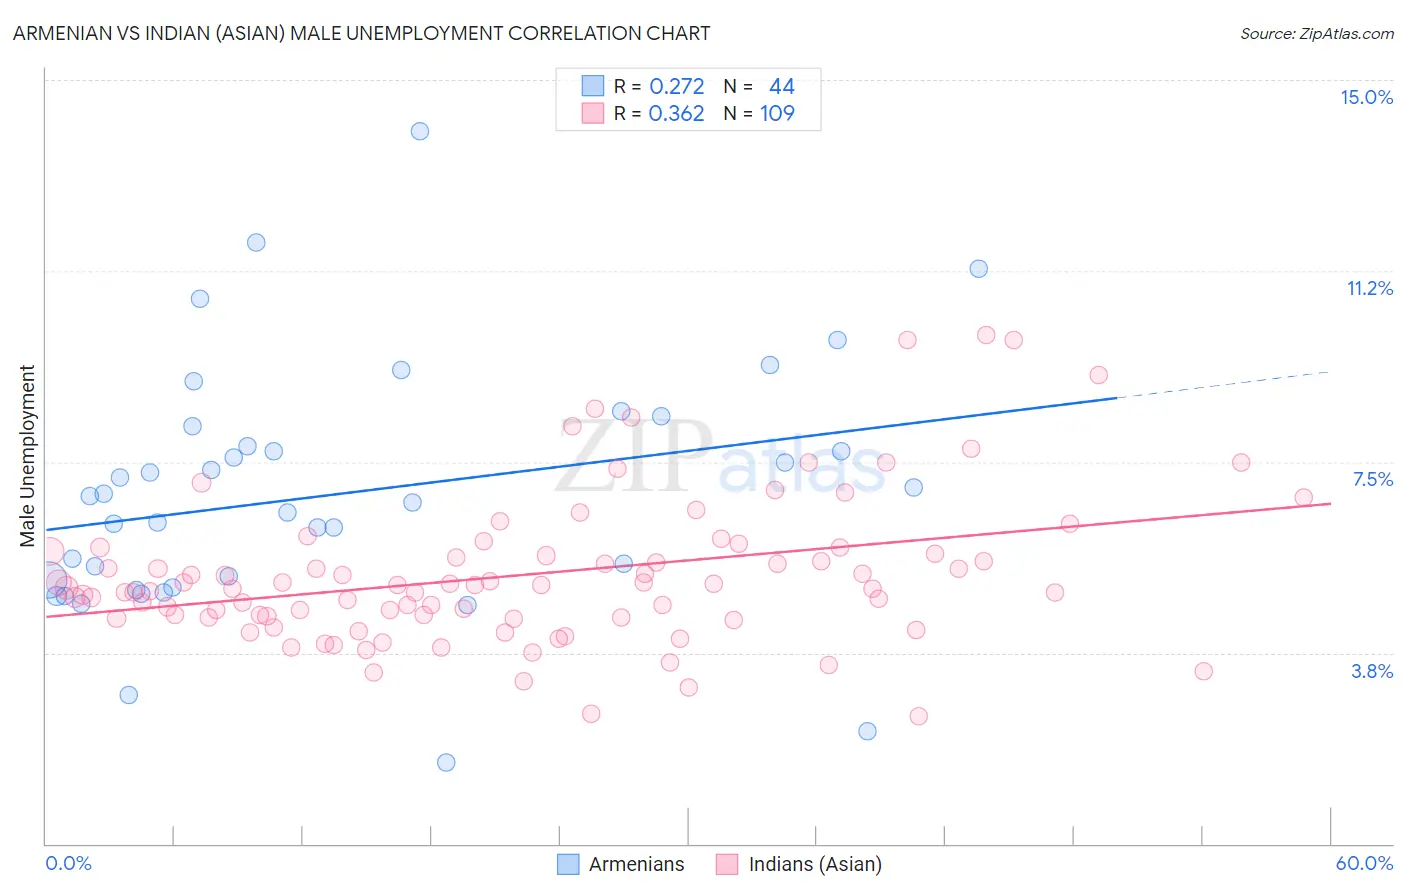
Armenian vs Indian (Asian) Male Unemployment Correlation Chart
The statistical analysis conducted on geographies consisting of 310,068,401 people shows a weak positive correlation between the proportion of Armenians and unemployment rate among males in the United States with a correlation coefficient (R) of 0.272 and weighted average of 6.0%. Similarly, the statistical analysis conducted on geographies consisting of 491,822,347 people shows a mild positive correlation between the proportion of Indians (Asian) and unemployment rate among males in the United States with a correlation coefficient (R) of 0.362 and weighted average of 5.2%, a difference of 15.3%.
Male Unemployment Correlation Summary
| Measurement | Armenian | Indian (Asian) |
| Minimum | 1.6% | 2.5% |
| Maximum | 14.0% | 10.0% |
| Range | 12.4% | 7.5% |
| Mean | 6.9% | 5.3% |
| Median | 6.8% | 5.0% |
| Interquartile 25% (IQ1) | 5.1% | 4.4% |
| Interquartile 75% (IQ3) | 8.0% | 5.7% |
| Interquartile Range (IQR) | 2.9% | 1.3% |
| Standard Deviation (Sample) | 2.4% | 1.5% |
| Standard Deviation (Population) | 2.4% | 1.4% |
Similar Demographics by Male Unemployment
Demographics Similar to Armenians by Male Unemployment
In terms of male unemployment, the demographic groups most similar to Armenians are Immigrants from Uzbekistan (6.0%, a difference of 0.010%), Immigrants from Sierra Leone (6.0%, a difference of 0.17%), Blackfeet (6.0%, a difference of 0.24%), Menominee (6.0%, a difference of 0.33%), and Tlingit-Haida (6.0%, a difference of 0.43%).
| Demographics | Rating | Rank | Male Unemployment |
| Bahamians | 0.0 /100 | #266 | Tragic 5.9% |
| Nigerians | 0.0 /100 | #267 | Tragic 5.9% |
| Bermudans | 0.0 /100 | #268 | Tragic 5.9% |
| Immigrants | Nigeria | 0.0 /100 | #269 | Tragic 6.0% |
| Sub-Saharan Africans | 0.0 /100 | #270 | Tragic 6.0% |
| Blackfeet | 0.0 /100 | #271 | Tragic 6.0% |
| Immigrants | Uzbekistan | 0.0 /100 | #272 | Tragic 6.0% |
| Armenians | 0.0 /100 | #273 | Tragic 6.0% |
| Immigrants | Sierra Leone | 0.0 /100 | #274 | Tragic 6.0% |
| Menominee | 0.0 /100 | #275 | Tragic 6.0% |
| Tlingit-Haida | 0.0 /100 | #276 | Tragic 6.0% |
| Immigrants | Liberia | 0.0 /100 | #277 | Tragic 6.1% |
| Immigrants | Fiji | 0.0 /100 | #278 | Tragic 6.1% |
| Ghanaians | 0.0 /100 | #279 | Tragic 6.1% |
| Immigrants | Ghana | 0.0 /100 | #280 | Tragic 6.2% |
Demographics Similar to Indians (Asian) by Male Unemployment
In terms of male unemployment, the demographic groups most similar to Indians (Asian) are Immigrants from Europe (5.2%, a difference of 0.020%), Immigrants from Italy (5.2%, a difference of 0.030%), Slovak (5.2%, a difference of 0.040%), Egyptian (5.2%, a difference of 0.090%), and Immigrants from Burma/Myanmar (5.2%, a difference of 0.12%).
| Demographics | Rating | Rank | Male Unemployment |
| Syrians | 78.0 /100 | #143 | Good 5.2% |
| Sri Lankans | 77.9 /100 | #144 | Good 5.2% |
| Macedonians | 77.7 /100 | #145 | Good 5.2% |
| Immigrants | Kenya | 77.6 /100 | #146 | Good 5.2% |
| Immigrants | Burma/Myanmar | 77.5 /100 | #147 | Good 5.2% |
| Immigrants | Italy | 76.3 /100 | #148 | Good 5.2% |
| Immigrants | Europe | 76.2 /100 | #149 | Good 5.2% |
| Indians (Asian) | 76.0 /100 | #150 | Good 5.2% |
| Slovaks | 75.5 /100 | #151 | Good 5.2% |
| Egyptians | 74.8 /100 | #152 | Good 5.2% |
| Immigrants | Uruguay | 73.9 /100 | #153 | Good 5.2% |
| Laotians | 73.8 /100 | #154 | Good 5.2% |
| Immigrants | Hungary | 73.4 /100 | #155 | Good 5.2% |
| Americans | 72.7 /100 | #156 | Good 5.2% |
| Immigrants | Northern Africa | 72.3 /100 | #157 | Good 5.2% |