Immigrants from Cuba vs Sioux Male Unemployment
COMPARE
Immigrants from Cuba
Sioux
Male Unemployment
Male Unemployment Comparison
Immigrants from Cuba
Sioux
4.4%
MALE UNEMPLOYMENT
100.0/ 100
METRIC RATING
2nd/ 347
METRIC RANK
8.4%
MALE UNEMPLOYMENT
0.0/ 100
METRIC RATING
333rd/ 347
METRIC RANK
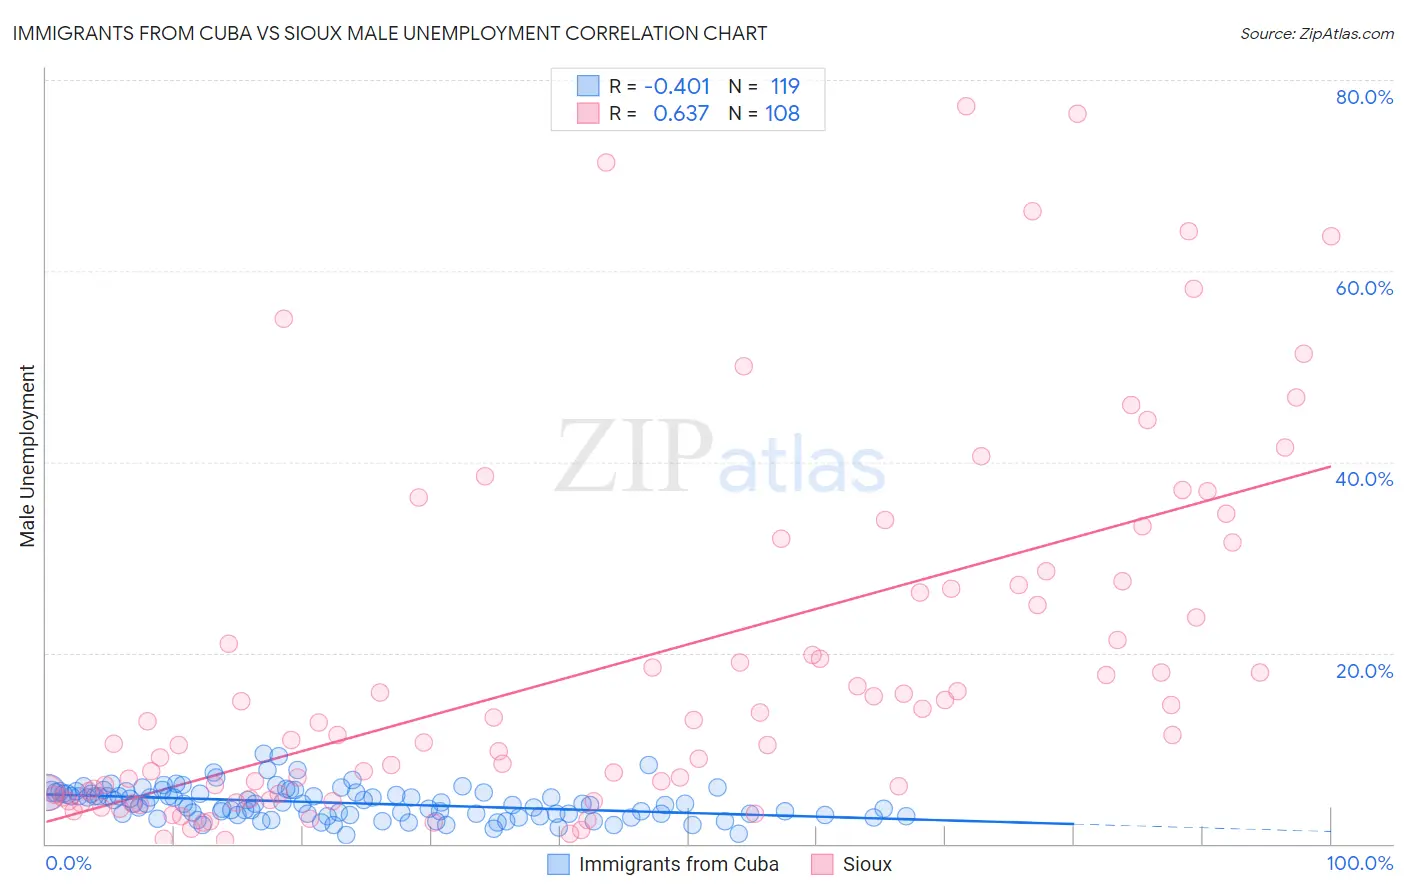
Immigrants from Cuba vs Sioux Male Unemployment Correlation Chart
The statistical analysis conducted on geographies consisting of 325,045,859 people shows a moderate negative correlation between the proportion of Immigrants from Cuba and unemployment rate among males in the United States with a correlation coefficient (R) of -0.401 and weighted average of 4.4%. Similarly, the statistical analysis conducted on geographies consisting of 232,900,714 people shows a significant positive correlation between the proportion of Sioux and unemployment rate among males in the United States with a correlation coefficient (R) of 0.637 and weighted average of 8.4%, a difference of 89.5%.
Male Unemployment Correlation Summary
| Measurement | Immigrants from Cuba | Sioux |
| Minimum | 0.90% | 0.40% |
| Maximum | 9.5% | 77.3% |
| Range | 8.6% | 76.9% |
| Mean | 4.3% | 18.8% |
| Median | 4.2% | 12.1% |
| Interquartile 25% (IQ1) | 3.1% | 5.1% |
| Interquartile 75% (IQ3) | 5.4% | 26.9% |
| Interquartile Range (IQR) | 2.3% | 21.8% |
| Standard Deviation (Sample) | 1.6% | 18.6% |
| Standard Deviation (Population) | 1.6% | 18.5% |
Similar Demographics by Male Unemployment
Demographics Similar to Immigrants from Cuba by Male Unemployment
In terms of male unemployment, the demographic groups most similar to Immigrants from Cuba are Norwegian (4.4%, a difference of 0.24%), Immigrants from Venezuela (4.4%, a difference of 0.58%), Immigrants from India (4.4%, a difference of 1.1%), Danish (4.5%, a difference of 1.6%), and Venezuelan (4.5%, a difference of 2.1%).
| Demographics | Rating | Rank | Male Unemployment |
| Immigrants | India | 100.0 /100 | #1 | Exceptional 4.4% |
| Immigrants | Cuba | 100.0 /100 | #2 | Exceptional 4.4% |
| Norwegians | 100.0 /100 | #3 | Exceptional 4.4% |
| Immigrants | Venezuela | 100.0 /100 | #4 | Exceptional 4.4% |
| Danes | 100.0 /100 | #5 | Exceptional 4.5% |
| Venezuelans | 100.0 /100 | #6 | Exceptional 4.5% |
| Czechs | 100.0 /100 | #7 | Exceptional 4.5% |
| Luxembourgers | 100.0 /100 | #8 | Exceptional 4.5% |
| Thais | 100.0 /100 | #9 | Exceptional 4.6% |
| Cubans | 100.0 /100 | #10 | Exceptional 4.6% |
| Swedes | 100.0 /100 | #11 | Exceptional 4.6% |
| Immigrants | Bolivia | 100.0 /100 | #12 | Exceptional 4.7% |
| Bolivians | 100.0 /100 | #13 | Exceptional 4.7% |
| Germans | 100.0 /100 | #14 | Exceptional 4.7% |
| Scandinavians | 100.0 /100 | #15 | Exceptional 4.7% |
Demographics Similar to Sioux by Male Unemployment
In terms of male unemployment, the demographic groups most similar to Sioux are Tsimshian (8.5%, a difference of 0.97%), Pueblo (8.5%, a difference of 1.0%), Pima (8.3%, a difference of 1.3%), Yuman (8.6%, a difference of 2.4%), and Puerto Rican (8.6%, a difference of 2.5%).
| Demographics | Rating | Rank | Male Unemployment |
| Immigrants | Dominican Republic | 0.0 /100 | #326 | Tragic 7.6% |
| Paiute | 0.0 /100 | #327 | Tragic 7.7% |
| Natives/Alaskans | 0.0 /100 | #328 | Tragic 7.7% |
| Immigrants | Yemen | 0.0 /100 | #329 | Tragic 7.8% |
| Yakama | 0.0 /100 | #330 | Tragic 7.9% |
| Alaska Natives | 0.0 /100 | #331 | Tragic 8.1% |
| Pima | 0.0 /100 | #332 | Tragic 8.3% |
| Sioux | 0.0 /100 | #333 | Tragic 8.4% |
| Tsimshian | 0.0 /100 | #334 | Tragic 8.5% |
| Pueblo | 0.0 /100 | #335 | Tragic 8.5% |
| Yuman | 0.0 /100 | #336 | Tragic 8.6% |
| Puerto Ricans | 0.0 /100 | #337 | Tragic 8.6% |
| Apache | 0.0 /100 | #338 | Tragic 8.6% |
| Cheyenne | 0.0 /100 | #339 | Tragic 9.8% |
| Alaskan Athabascans | 0.0 /100 | #340 | Tragic 9.8% |