Armenian vs Sioux Disability Age 35 to 64
COMPARE
Armenian
Sioux
Disability Age 35 to 64
Disability Age 35 to 64 Comparison
Armenians
Sioux
9.9%
DISABILITY AGE 35 TO 64
99.8/ 100
METRIC RATING
58th/ 347
METRIC RANK
13.9%
DISABILITY AGE 35 TO 64
0.0/ 100
METRIC RATING
303rd/ 347
METRIC RANK
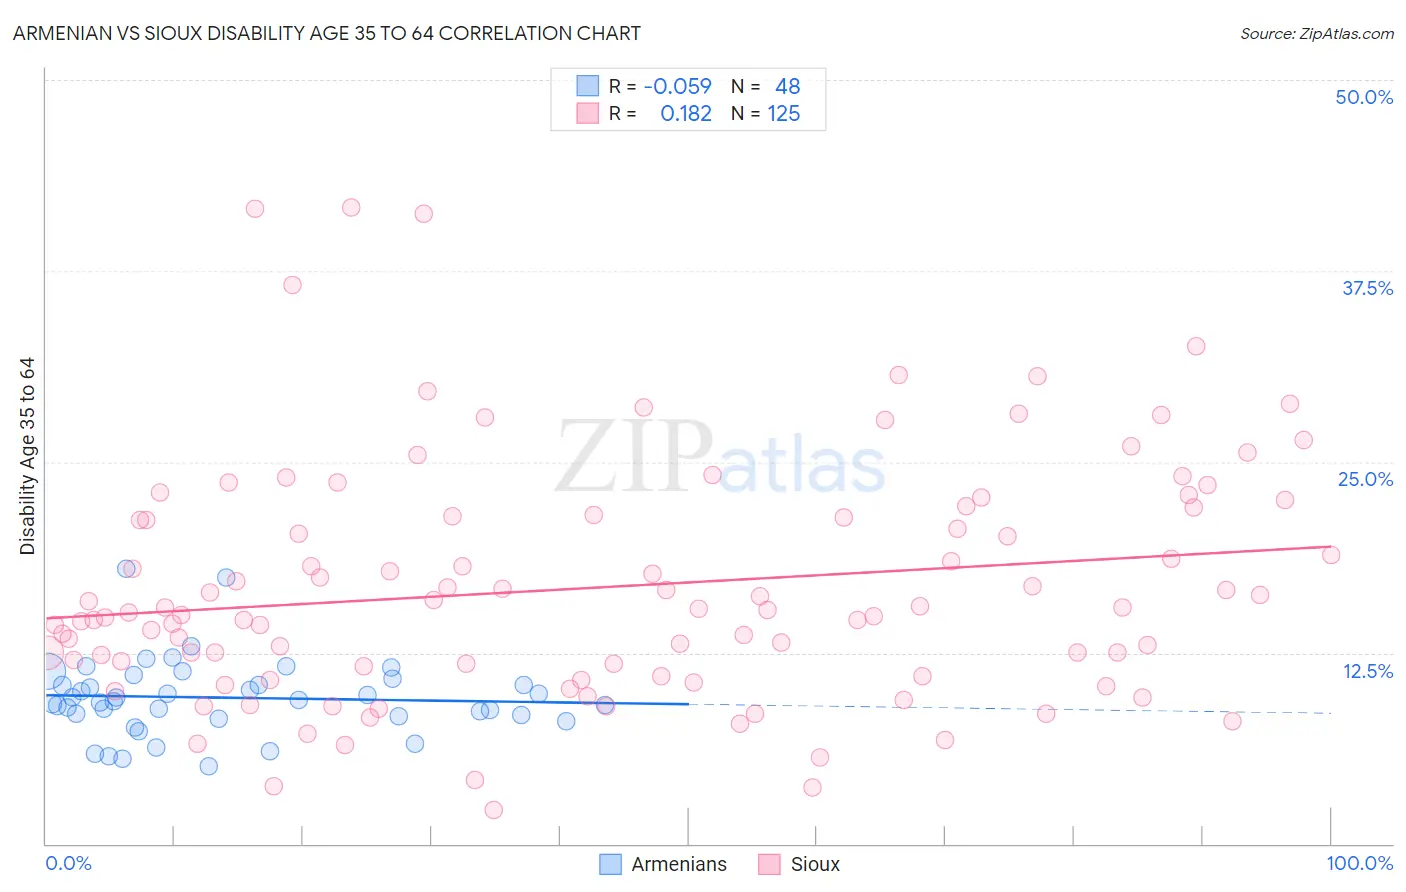
Armenian vs Sioux Disability Age 35 to 64 Correlation Chart
The statistical analysis conducted on geographies consisting of 310,760,259 people shows a slight negative correlation between the proportion of Armenians and percentage of population with a disability between the ages 34 and 64 in the United States with a correlation coefficient (R) of -0.059 and weighted average of 9.9%. Similarly, the statistical analysis conducted on geographies consisting of 234,072,168 people shows a poor positive correlation between the proportion of Sioux and percentage of population with a disability between the ages 34 and 64 in the United States with a correlation coefficient (R) of 0.182 and weighted average of 13.9%, a difference of 40.1%.
Disability Age 35 to 64 Correlation Summary
| Measurement | Armenian | Sioux |
| Minimum | 5.1% | 2.2% |
| Maximum | 18.0% | 41.7% |
| Range | 12.9% | 39.5% |
| Mean | 9.6% | 16.8% |
| Median | 9.4% | 15.3% |
| Interquartile 25% (IQ1) | 8.4% | 11.3% |
| Interquartile 75% (IQ3) | 10.6% | 21.5% |
| Interquartile Range (IQR) | 2.3% | 10.2% |
| Standard Deviation (Sample) | 2.5% | 7.8% |
| Standard Deviation (Population) | 2.5% | 7.8% |
Similar Demographics by Disability Age 35 to 64
Demographics Similar to Armenians by Disability Age 35 to 64
In terms of disability age 35 to 64, the demographic groups most similar to Armenians are Colombian (9.9%, a difference of 0.10%), South American (9.9%, a difference of 0.12%), Immigrants from Sweden (9.9%, a difference of 0.30%), Peruvian (9.9%, a difference of 0.34%), and Immigrants from Russia (9.8%, a difference of 0.40%).
| Demographics | Rating | Rank | Disability Age 35 to 64 |
| Bhutanese | 99.8 /100 | #51 | Exceptional 9.8% |
| Immigrants | Bulgaria | 99.8 /100 | #52 | Exceptional 9.8% |
| Taiwanese | 99.8 /100 | #53 | Exceptional 9.8% |
| Immigrants | Russia | 99.8 /100 | #54 | Exceptional 9.8% |
| Peruvians | 99.8 /100 | #55 | Exceptional 9.9% |
| South Americans | 99.8 /100 | #56 | Exceptional 9.9% |
| Colombians | 99.8 /100 | #57 | Exceptional 9.9% |
| Armenians | 99.8 /100 | #58 | Exceptional 9.9% |
| Immigrants | Sweden | 99.7 /100 | #59 | Exceptional 9.9% |
| Immigrants | South America | 99.7 /100 | #60 | Exceptional 9.9% |
| Immigrants | Spain | 99.7 /100 | #61 | Exceptional 10.0% |
| Eastern Europeans | 99.7 /100 | #62 | Exceptional 10.0% |
| Immigrants | Czechoslovakia | 99.7 /100 | #63 | Exceptional 10.0% |
| Immigrants | Romania | 99.7 /100 | #64 | Exceptional 10.0% |
| Immigrants | Poland | 99.6 /100 | #65 | Exceptional 10.0% |
Demographics Similar to Sioux by Disability Age 35 to 64
In terms of disability age 35 to 64, the demographic groups most similar to Sioux are Hopi (13.9%, a difference of 0.030%), Aleut (13.8%, a difference of 0.18%), American (13.9%, a difference of 0.41%), French American Indian (13.7%, a difference of 1.1%), and Immigrants from Yemen (14.0%, a difference of 1.3%).
| Demographics | Rating | Rank | Disability Age 35 to 64 |
| Africans | 0.0 /100 | #296 | Tragic 13.6% |
| Bangladeshis | 0.0 /100 | #297 | Tragic 13.6% |
| Cheyenne | 0.0 /100 | #298 | Tragic 13.6% |
| Spanish Americans | 0.0 /100 | #299 | Tragic 13.7% |
| Delaware | 0.0 /100 | #300 | Tragic 13.7% |
| French American Indians | 0.0 /100 | #301 | Tragic 13.7% |
| Aleuts | 0.0 /100 | #302 | Tragic 13.8% |
| Sioux | 0.0 /100 | #303 | Tragic 13.9% |
| Hopi | 0.0 /100 | #304 | Tragic 13.9% |
| Americans | 0.0 /100 | #305 | Tragic 13.9% |
| Immigrants | Yemen | 0.0 /100 | #306 | Tragic 14.0% |
| Blackfeet | 0.0 /100 | #307 | Tragic 14.1% |
| Inupiat | 0.0 /100 | #308 | Tragic 14.1% |
| Cree | 0.0 /100 | #309 | Tragic 14.1% |
| Cape Verdeans | 0.0 /100 | #310 | Tragic 14.1% |