Arab vs Immigrants from Fiji Unemployment
COMPARE
Arab
Immigrants from Fiji
Unemployment
Unemployment Comparison
Arabs
Immigrants from Fiji
5.3%
UNEMPLOYMENT
35.3/ 100
METRIC RATING
190th/ 347
METRIC RANK
5.9%
UNEMPLOYMENT
0.0/ 100
METRIC RATING
273rd/ 347
METRIC RANK
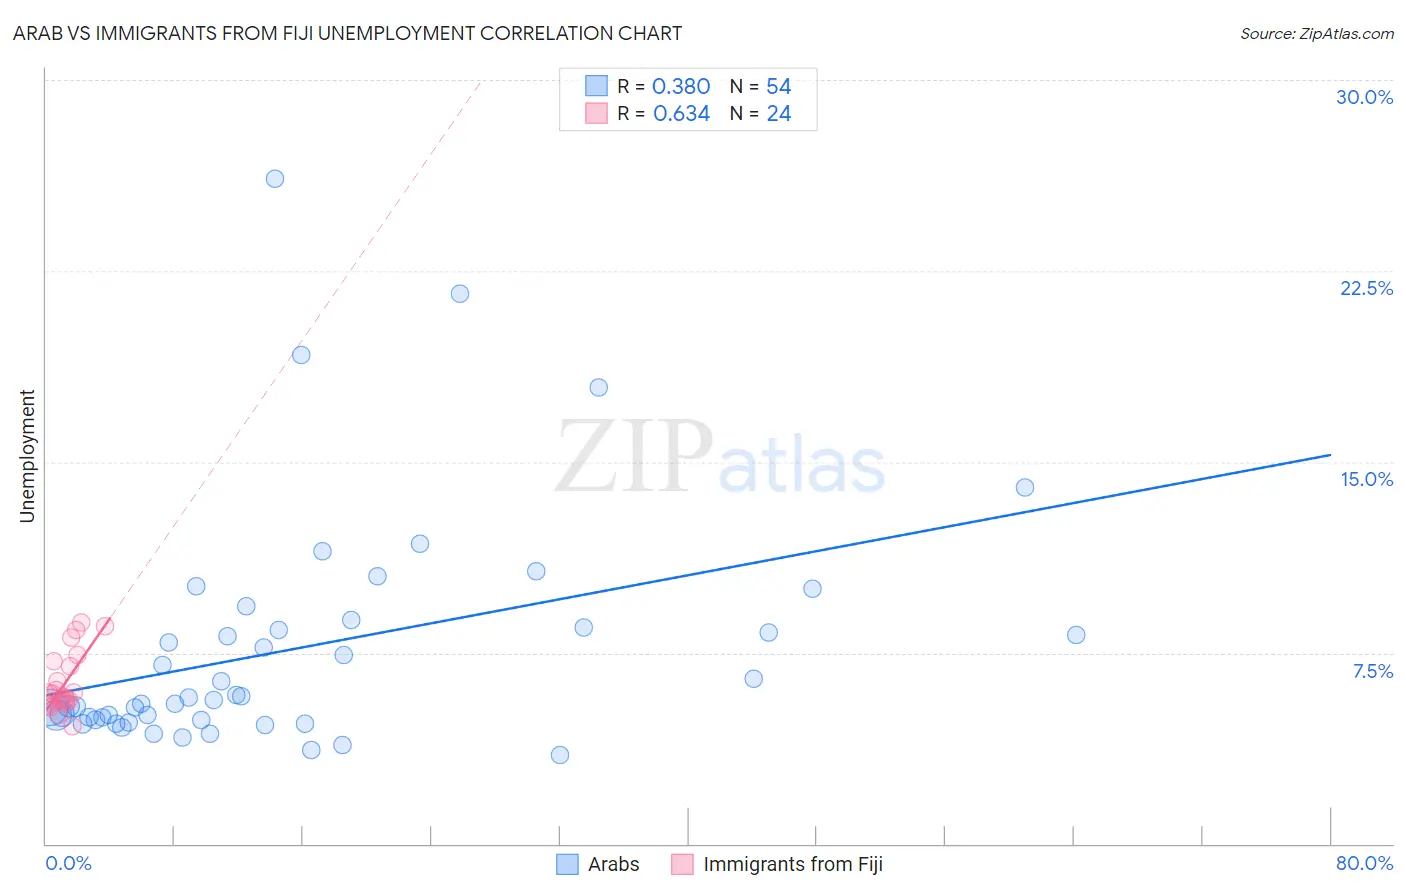
Arab vs Immigrants from Fiji Unemployment Correlation Chart
The statistical analysis conducted on geographies consisting of 486,097,556 people shows a mild positive correlation between the proportion of Arabs and unemployment in the United States with a correlation coefficient (R) of 0.380 and weighted average of 5.3%. Similarly, the statistical analysis conducted on geographies consisting of 93,754,040 people shows a significant positive correlation between the proportion of Immigrants from Fiji and unemployment in the United States with a correlation coefficient (R) of 0.634 and weighted average of 5.9%, a difference of 11.4%.
Unemployment Correlation Summary
| Measurement | Arab | Immigrants from Fiji |
| Minimum | 3.5% | 4.6% |
| Maximum | 26.1% | 8.7% |
| Range | 22.6% | 4.1% |
| Mean | 7.7% | 6.3% |
| Median | 5.7% | 5.8% |
| Interquartile 25% (IQ1) | 4.9% | 5.6% |
| Interquartile 75% (IQ3) | 8.5% | 7.1% |
| Interquartile Range (IQR) | 3.6% | 1.5% |
| Standard Deviation (Sample) | 4.6% | 1.2% |
| Standard Deviation (Population) | 4.6% | 1.1% |
Similar Demographics by Unemployment
Demographics Similar to Arabs by Unemployment
In terms of unemployment, the demographic groups most similar to Arabs are Immigrants from Belarus (5.3%, a difference of 0.020%), Somali (5.3%, a difference of 0.090%), South American (5.3%, a difference of 0.090%), Immigrants from Somalia (5.3%, a difference of 0.10%), and Alsatian (5.3%, a difference of 0.11%).
| Demographics | Rating | Rank | Unemployment |
| Brazilians | 40.2 /100 | #183 | Average 5.3% |
| Assyrians/Chaldeans/Syriacs | 39.2 /100 | #184 | Fair 5.3% |
| Immigrants | Thailand | 38.9 /100 | #185 | Fair 5.3% |
| Immigrants | Uganda | 37.8 /100 | #186 | Fair 5.3% |
| Costa Ricans | 37.4 /100 | #187 | Fair 5.3% |
| Alsatians | 37.0 /100 | #188 | Fair 5.3% |
| Immigrants | Belarus | 35.6 /100 | #189 | Fair 5.3% |
| Arabs | 35.3 /100 | #190 | Fair 5.3% |
| Somalis | 34.0 /100 | #191 | Fair 5.3% |
| South Americans | 33.9 /100 | #192 | Fair 5.3% |
| Immigrants | Somalia | 33.8 /100 | #193 | Fair 5.3% |
| Immigrants | Laos | 30.9 /100 | #194 | Fair 5.3% |
| Immigrants | Southern Europe | 30.9 /100 | #195 | Fair 5.3% |
| Peruvians | 29.9 /100 | #196 | Fair 5.3% |
| Immigrants | Uruguay | 29.8 /100 | #197 | Fair 5.3% |
Demographics Similar to Immigrants from Fiji by Unemployment
In terms of unemployment, the demographic groups most similar to Immigrants from Fiji are Hispanic or Latino (5.9%, a difference of 0.17%), Bahamian (5.9%, a difference of 0.29%), Immigrants from Latin America (5.9%, a difference of 0.50%), Immigrants from Central America (6.0%, a difference of 0.78%), and Mexican (5.9%, a difference of 0.85%).
| Demographics | Rating | Rank | Unemployment |
| Mexican American Indians | 0.1 /100 | #266 | Tragic 5.8% |
| Immigrants | Nigeria | 0.1 /100 | #267 | Tragic 5.8% |
| Immigrants | Sierra Leone | 0.1 /100 | #268 | Tragic 5.8% |
| Immigrants | El Salvador | 0.1 /100 | #269 | Tragic 5.8% |
| Blackfeet | 0.1 /100 | #270 | Tragic 5.8% |
| Mexicans | 0.1 /100 | #271 | Tragic 5.9% |
| Hispanics or Latinos | 0.0 /100 | #272 | Tragic 5.9% |
| Immigrants | Fiji | 0.0 /100 | #273 | Tragic 5.9% |
| Bahamians | 0.0 /100 | #274 | Tragic 5.9% |
| Immigrants | Latin America | 0.0 /100 | #275 | Tragic 5.9% |
| Immigrants | Central America | 0.0 /100 | #276 | Tragic 6.0% |
| Armenians | 0.0 /100 | #277 | Tragic 6.0% |
| Ghanaians | 0.0 /100 | #278 | Tragic 6.0% |
| Immigrants | Mexico | 0.0 /100 | #279 | Tragic 6.0% |
| Immigrants | Western Africa | 0.0 /100 | #280 | Tragic 6.0% |