Arab vs Immigrants from Yemen Unemployment
COMPARE
Arab
Immigrants from Yemen
Unemployment
Unemployment Comparison
Arabs
Immigrants from Yemen
5.3%
UNEMPLOYMENT
35.3/ 100
METRIC RATING
190th/ 347
METRIC RANK
7.7%
UNEMPLOYMENT
0.0/ 100
METRIC RATING
336th/ 347
METRIC RANK
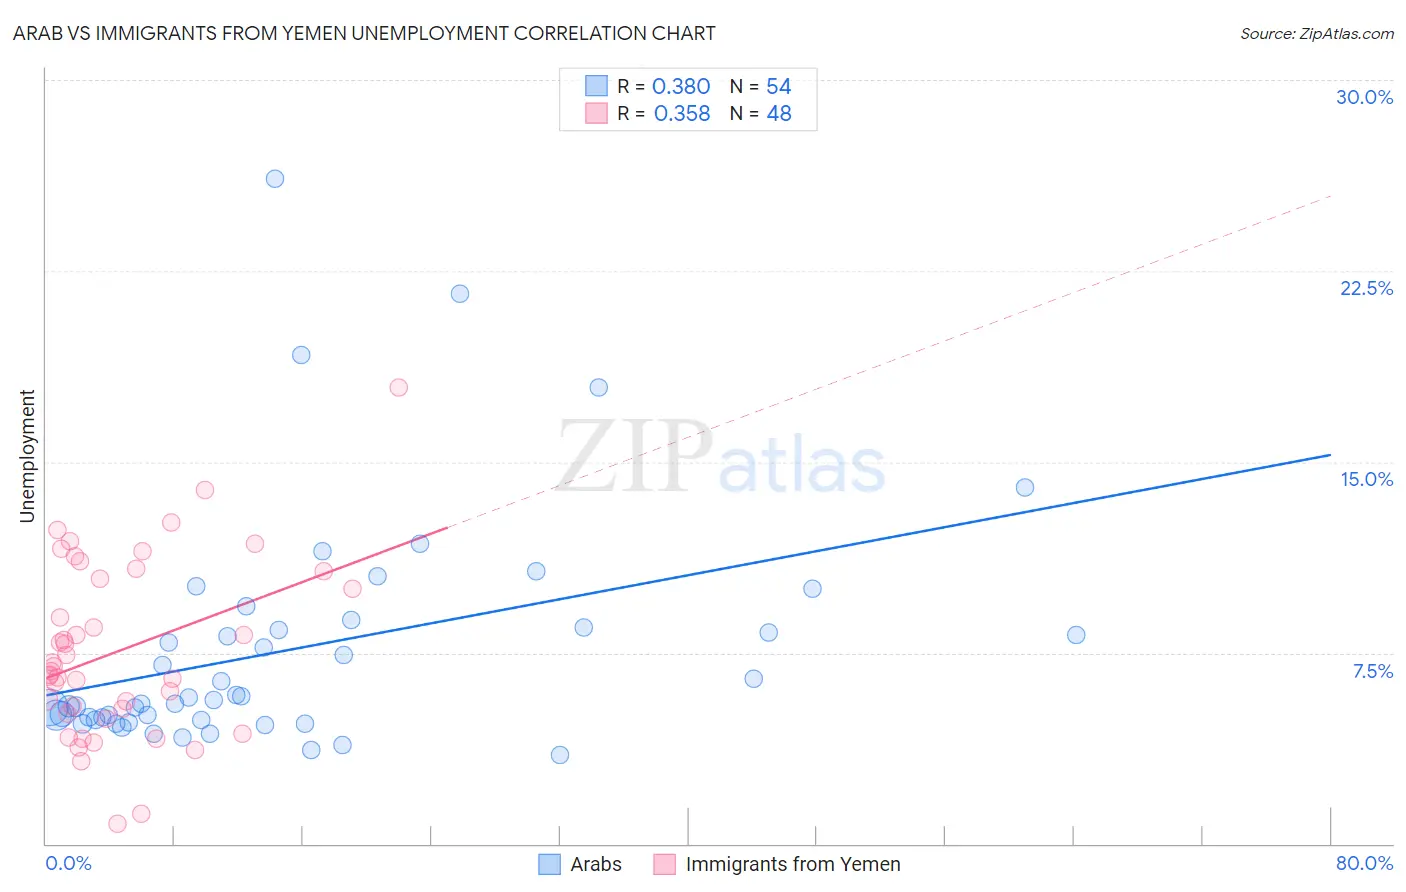
Arab vs Immigrants from Yemen Unemployment Correlation Chart
The statistical analysis conducted on geographies consisting of 486,097,556 people shows a mild positive correlation between the proportion of Arabs and unemployment in the United States with a correlation coefficient (R) of 0.380 and weighted average of 5.3%. Similarly, the statistical analysis conducted on geographies consisting of 82,429,488 people shows a mild positive correlation between the proportion of Immigrants from Yemen and unemployment in the United States with a correlation coefficient (R) of 0.358 and weighted average of 7.7%, a difference of 45.2%.
Unemployment Correlation Summary
| Measurement | Arab | Immigrants from Yemen |
| Minimum | 3.5% | 0.80% |
| Maximum | 26.1% | 17.9% |
| Range | 22.6% | 17.1% |
| Mean | 7.7% | 7.6% |
| Median | 5.7% | 6.9% |
| Interquartile 25% (IQ1) | 4.9% | 5.2% |
| Interquartile 75% (IQ3) | 8.5% | 10.6% |
| Interquartile Range (IQR) | 3.6% | 5.4% |
| Standard Deviation (Sample) | 4.6% | 3.5% |
| Standard Deviation (Population) | 4.6% | 3.4% |
Similar Demographics by Unemployment
Demographics Similar to Arabs by Unemployment
In terms of unemployment, the demographic groups most similar to Arabs are Immigrants from Belarus (5.3%, a difference of 0.020%), Somali (5.3%, a difference of 0.090%), South American (5.3%, a difference of 0.090%), Immigrants from Somalia (5.3%, a difference of 0.10%), and Alsatian (5.3%, a difference of 0.11%).
| Demographics | Rating | Rank | Unemployment |
| Brazilians | 40.2 /100 | #183 | Average 5.3% |
| Assyrians/Chaldeans/Syriacs | 39.2 /100 | #184 | Fair 5.3% |
| Immigrants | Thailand | 38.9 /100 | #185 | Fair 5.3% |
| Immigrants | Uganda | 37.8 /100 | #186 | Fair 5.3% |
| Costa Ricans | 37.4 /100 | #187 | Fair 5.3% |
| Alsatians | 37.0 /100 | #188 | Fair 5.3% |
| Immigrants | Belarus | 35.6 /100 | #189 | Fair 5.3% |
| Arabs | 35.3 /100 | #190 | Fair 5.3% |
| Somalis | 34.0 /100 | #191 | Fair 5.3% |
| South Americans | 33.9 /100 | #192 | Fair 5.3% |
| Immigrants | Somalia | 33.8 /100 | #193 | Fair 5.3% |
| Immigrants | Laos | 30.9 /100 | #194 | Fair 5.3% |
| Immigrants | Southern Europe | 30.9 /100 | #195 | Fair 5.3% |
| Peruvians | 29.9 /100 | #196 | Fair 5.3% |
| Immigrants | Uruguay | 29.8 /100 | #197 | Fair 5.3% |
Demographics Similar to Immigrants from Yemen by Unemployment
In terms of unemployment, the demographic groups most similar to Immigrants from Yemen are Alaskan Athabascan (7.7%, a difference of 0.72%), Apache (7.4%, a difference of 3.8%), Cheyenne (8.0%, a difference of 3.8%), Immigrants from Dominican Republic (7.4%, a difference of 4.3%), and Sioux (7.4%, a difference of 4.3%).
| Demographics | Rating | Rank | Unemployment |
| Alaska Natives | 0.0 /100 | #329 | Tragic 7.2% |
| Yakama | 0.0 /100 | #330 | Tragic 7.3% |
| Dominicans | 0.0 /100 | #331 | Tragic 7.4% |
| Sioux | 0.0 /100 | #332 | Tragic 7.4% |
| Immigrants | Dominican Republic | 0.0 /100 | #333 | Tragic 7.4% |
| Apache | 0.0 /100 | #334 | Tragic 7.4% |
| Alaskan Athabascans | 0.0 /100 | #335 | Tragic 7.7% |
| Immigrants | Yemen | 0.0 /100 | #336 | Tragic 7.7% |
| Cheyenne | 0.0 /100 | #337 | Tragic 8.0% |
| Pima | 0.0 /100 | #338 | Tragic 8.2% |
| Navajo | 0.0 /100 | #339 | Tragic 8.4% |
| Puerto Ricans | 0.0 /100 | #340 | Tragic 8.4% |
| Tohono O'odham | 0.0 /100 | #341 | Tragic 8.9% |
| Hopi | 0.0 /100 | #342 | Tragic 8.9% |
| Yuman | 0.0 /100 | #343 | Tragic 9.1% |