Immigrants from Egypt vs Immigrants from Fiji Unemployment
COMPARE
Immigrants from Egypt
Immigrants from Fiji
Unemployment
Unemployment Comparison
Immigrants from Egypt
Immigrants from Fiji
5.2%
UNEMPLOYMENT
66.7/ 100
METRIC RATING
158th/ 347
METRIC RANK
5.9%
UNEMPLOYMENT
0.0/ 100
METRIC RATING
273rd/ 347
METRIC RANK
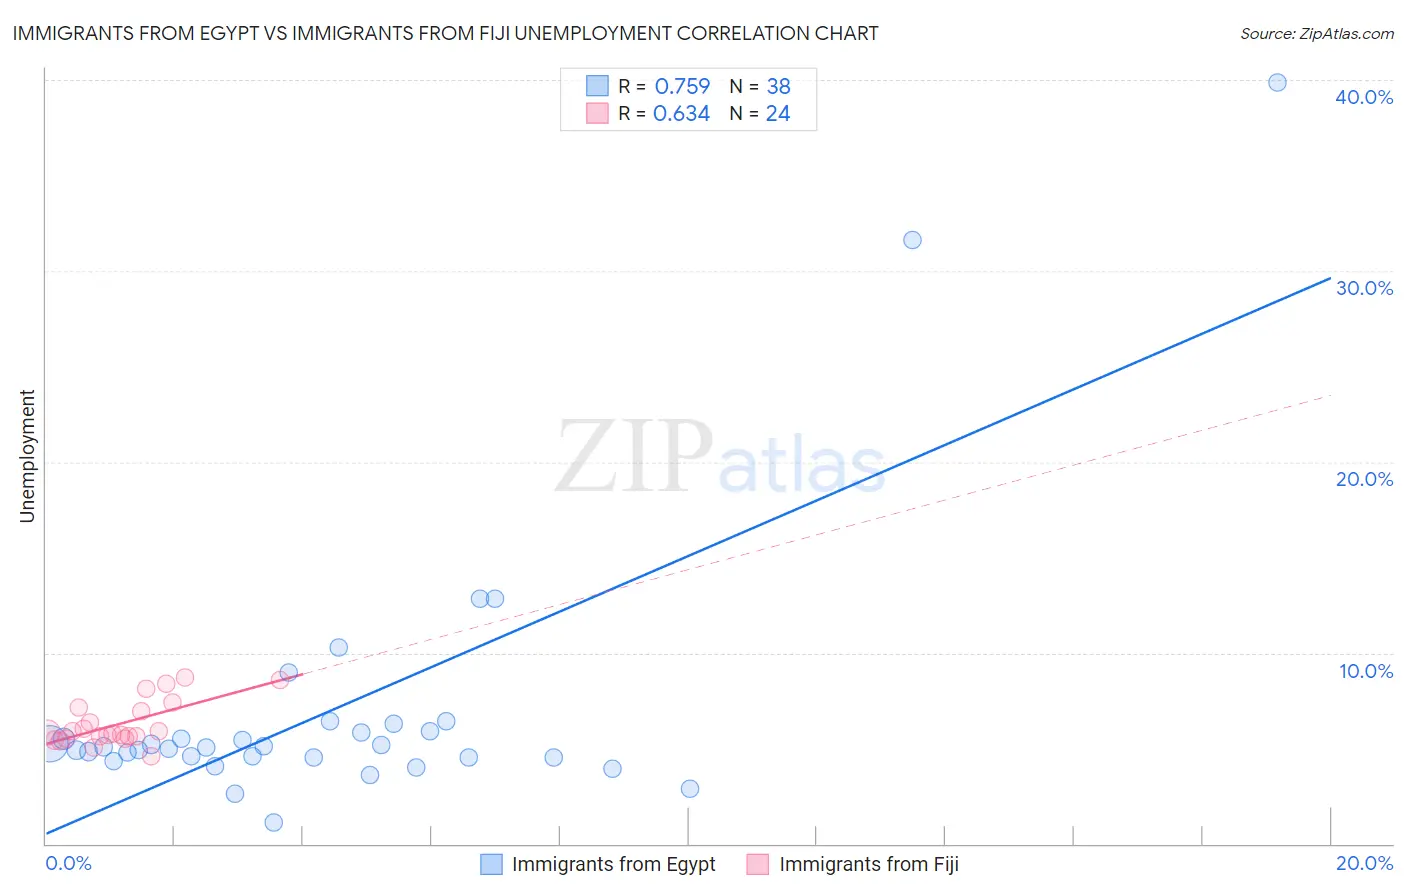
Immigrants from Egypt vs Immigrants from Fiji Unemployment Correlation Chart
The statistical analysis conducted on geographies consisting of 245,443,113 people shows a strong positive correlation between the proportion of Immigrants from Egypt and unemployment in the United States with a correlation coefficient (R) of 0.759 and weighted average of 5.2%. Similarly, the statistical analysis conducted on geographies consisting of 93,754,040 people shows a significant positive correlation between the proportion of Immigrants from Fiji and unemployment in the United States with a correlation coefficient (R) of 0.634 and weighted average of 5.9%, a difference of 13.6%.
Unemployment Correlation Summary
| Measurement | Immigrants from Egypt | Immigrants from Fiji |
| Minimum | 1.1% | 4.6% |
| Maximum | 39.9% | 8.7% |
| Range | 38.8% | 4.1% |
| Mean | 7.1% | 6.3% |
| Median | 5.0% | 5.8% |
| Interquartile 25% (IQ1) | 4.5% | 5.6% |
| Interquartile 75% (IQ3) | 5.9% | 7.1% |
| Interquartile Range (IQR) | 1.4% | 1.5% |
| Standard Deviation (Sample) | 7.3% | 1.2% |
| Standard Deviation (Population) | 7.2% | 1.1% |
Similar Demographics by Unemployment
Demographics Similar to Immigrants from Egypt by Unemployment
In terms of unemployment, the demographic groups most similar to Immigrants from Egypt are Immigrants from Russia (5.2%, a difference of 0.0%), Laotian (5.2%, a difference of 0.020%), Immigrants from Oceania (5.2%, a difference of 0.10%), Spanish (5.2%, a difference of 0.11%), and Immigrants from Zaire (5.2%, a difference of 0.13%).
| Demographics | Rating | Rank | Unemployment |
| Immigrants | Eastern Europe | 75.3 /100 | #151 | Good 5.2% |
| Immigrants | Hong Kong | 75.2 /100 | #152 | Good 5.2% |
| Egyptians | 75.2 /100 | #153 | Good 5.2% |
| Immigrants | China | 74.7 /100 | #154 | Good 5.2% |
| Immigrants | Northern Africa | 71.3 /100 | #155 | Good 5.2% |
| Immigrants | Kazakhstan | 70.4 /100 | #156 | Good 5.2% |
| Sri Lankans | 69.5 /100 | #157 | Good 5.2% |
| Immigrants | Egypt | 66.7 /100 | #158 | Good 5.2% |
| Immigrants | Russia | 66.6 /100 | #159 | Good 5.2% |
| Laotians | 66.3 /100 | #160 | Good 5.2% |
| Immigrants | Oceania | 65.2 /100 | #161 | Good 5.2% |
| Spanish | 65.1 /100 | #162 | Good 5.2% |
| Immigrants | Zaire | 64.7 /100 | #163 | Good 5.2% |
| Immigrants | Colombia | 64.7 /100 | #164 | Good 5.2% |
| Immigrants | Brazil | 63.1 /100 | #165 | Good 5.2% |
Demographics Similar to Immigrants from Fiji by Unemployment
In terms of unemployment, the demographic groups most similar to Immigrants from Fiji are Hispanic or Latino (5.9%, a difference of 0.17%), Bahamian (5.9%, a difference of 0.29%), Immigrants from Latin America (5.9%, a difference of 0.50%), Immigrants from Central America (6.0%, a difference of 0.78%), and Mexican (5.9%, a difference of 0.85%).
| Demographics | Rating | Rank | Unemployment |
| Mexican American Indians | 0.1 /100 | #266 | Tragic 5.8% |
| Immigrants | Nigeria | 0.1 /100 | #267 | Tragic 5.8% |
| Immigrants | Sierra Leone | 0.1 /100 | #268 | Tragic 5.8% |
| Immigrants | El Salvador | 0.1 /100 | #269 | Tragic 5.8% |
| Blackfeet | 0.1 /100 | #270 | Tragic 5.8% |
| Mexicans | 0.1 /100 | #271 | Tragic 5.9% |
| Hispanics or Latinos | 0.0 /100 | #272 | Tragic 5.9% |
| Immigrants | Fiji | 0.0 /100 | #273 | Tragic 5.9% |
| Bahamians | 0.0 /100 | #274 | Tragic 5.9% |
| Immigrants | Latin America | 0.0 /100 | #275 | Tragic 5.9% |
| Immigrants | Central America | 0.0 /100 | #276 | Tragic 6.0% |
| Armenians | 0.0 /100 | #277 | Tragic 6.0% |
| Ghanaians | 0.0 /100 | #278 | Tragic 6.0% |
| Immigrants | Mexico | 0.0 /100 | #279 | Tragic 6.0% |
| Immigrants | Western Africa | 0.0 /100 | #280 | Tragic 6.0% |