Immigrants from Middle Africa vs Immigrants from Fiji Unemployment
COMPARE
Immigrants from Middle Africa
Immigrants from Fiji
Unemployment
Unemployment Comparison
Immigrants from Middle Africa
Immigrants from Fiji
5.4%
UNEMPLOYMENT
15.3/ 100
METRIC RATING
213th/ 347
METRIC RANK
5.9%
UNEMPLOYMENT
0.0/ 100
METRIC RATING
273rd/ 347
METRIC RANK
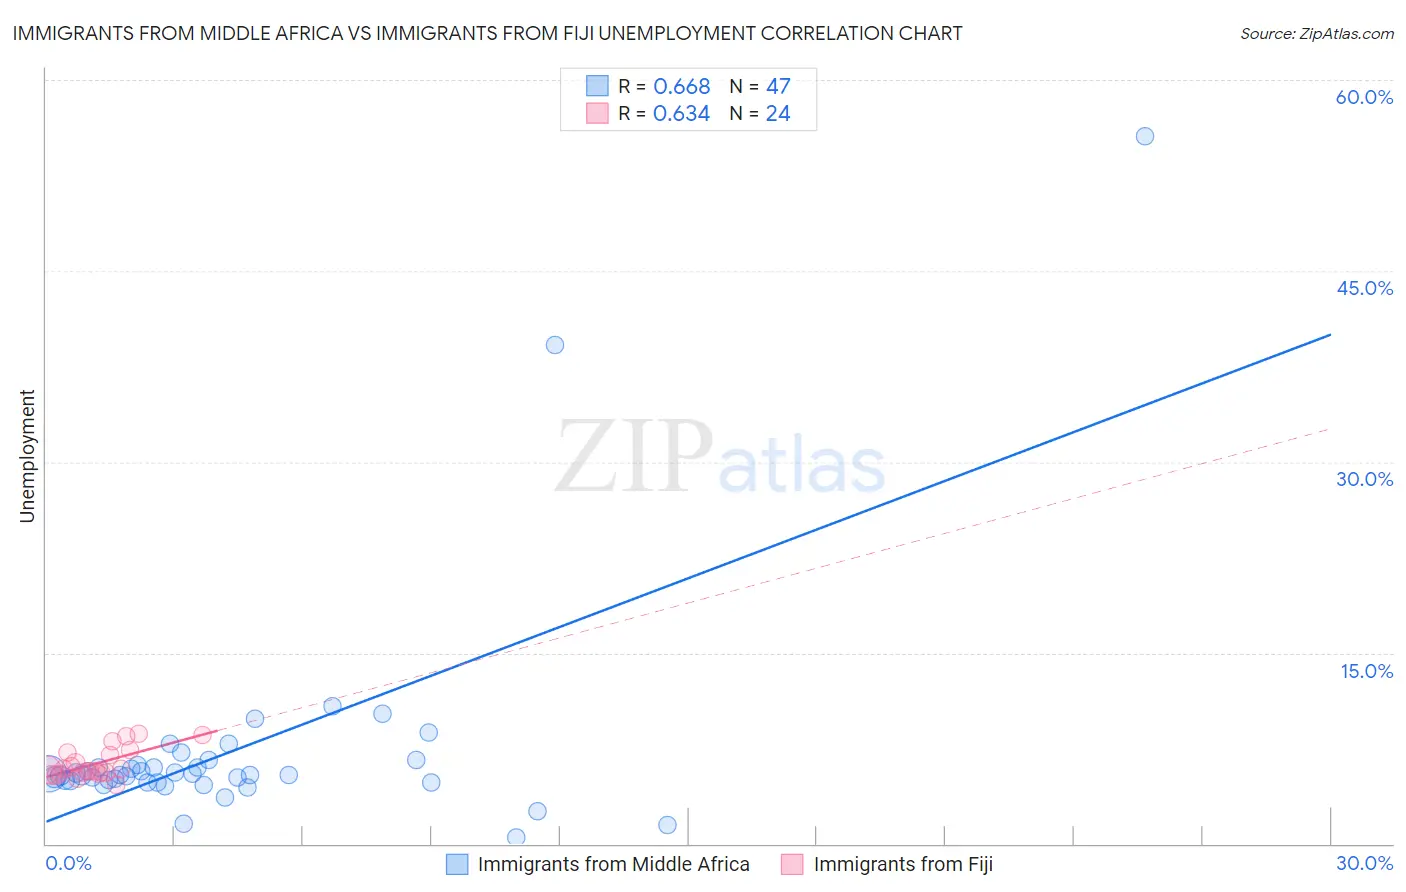
Immigrants from Middle Africa vs Immigrants from Fiji Unemployment Correlation Chart
The statistical analysis conducted on geographies consisting of 202,675,863 people shows a significant positive correlation between the proportion of Immigrants from Middle Africa and unemployment in the United States with a correlation coefficient (R) of 0.668 and weighted average of 5.4%. Similarly, the statistical analysis conducted on geographies consisting of 93,754,040 people shows a significant positive correlation between the proportion of Immigrants from Fiji and unemployment in the United States with a correlation coefficient (R) of 0.634 and weighted average of 5.9%, a difference of 9.5%.
Unemployment Correlation Summary
| Measurement | Immigrants from Middle Africa | Immigrants from Fiji |
| Minimum | 0.50% | 4.6% |
| Maximum | 55.6% | 8.7% |
| Range | 55.1% | 4.1% |
| Mean | 7.3% | 6.3% |
| Median | 5.4% | 5.8% |
| Interquartile 25% (IQ1) | 4.8% | 5.6% |
| Interquartile 75% (IQ3) | 6.1% | 7.1% |
| Interquartile Range (IQR) | 1.3% | 1.5% |
| Standard Deviation (Sample) | 8.9% | 1.2% |
| Standard Deviation (Population) | 8.8% | 1.1% |
Similar Demographics by Unemployment
Demographics Similar to Immigrants from Middle Africa by Unemployment
In terms of unemployment, the demographic groups most similar to Immigrants from Middle Africa are Immigrants from Costa Rica (5.4%, a difference of 0.0%), Delaware (5.4%, a difference of 0.060%), Immigrants from South America (5.4%, a difference of 0.22%), Immigrants from Albania (5.4%, a difference of 0.22%), and Ugandan (5.4%, a difference of 0.29%).
| Demographics | Rating | Rank | Unemployment |
| Immigrants | Peru | 22.7 /100 | #206 | Fair 5.4% |
| Creek | 19.4 /100 | #207 | Poor 5.4% |
| Portuguese | 19.0 /100 | #208 | Poor 5.4% |
| Immigrants | Iran | 18.8 /100 | #209 | Poor 5.4% |
| Immigrants | Iraq | 18.6 /100 | #210 | Poor 5.4% |
| Iraqis | 18.1 /100 | #211 | Poor 5.4% |
| Ugandans | 18.0 /100 | #212 | Poor 5.4% |
| Immigrants | Middle Africa | 15.3 /100 | #213 | Poor 5.4% |
| Immigrants | Costa Rica | 15.2 /100 | #214 | Poor 5.4% |
| Delaware | 14.7 /100 | #215 | Poor 5.4% |
| Immigrants | South America | 13.5 /100 | #216 | Poor 5.4% |
| Immigrants | Albania | 13.5 /100 | #217 | Poor 5.4% |
| Choctaw | 12.7 /100 | #218 | Poor 5.4% |
| Bangladeshis | 11.2 /100 | #219 | Poor 5.4% |
| Soviet Union | 10.6 /100 | #220 | Poor 5.4% |
Demographics Similar to Immigrants from Fiji by Unemployment
In terms of unemployment, the demographic groups most similar to Immigrants from Fiji are Hispanic or Latino (5.9%, a difference of 0.17%), Bahamian (5.9%, a difference of 0.29%), Immigrants from Latin America (5.9%, a difference of 0.50%), Immigrants from Central America (6.0%, a difference of 0.78%), and Mexican (5.9%, a difference of 0.85%).
| Demographics | Rating | Rank | Unemployment |
| Mexican American Indians | 0.1 /100 | #266 | Tragic 5.8% |
| Immigrants | Nigeria | 0.1 /100 | #267 | Tragic 5.8% |
| Immigrants | Sierra Leone | 0.1 /100 | #268 | Tragic 5.8% |
| Immigrants | El Salvador | 0.1 /100 | #269 | Tragic 5.8% |
| Blackfeet | 0.1 /100 | #270 | Tragic 5.8% |
| Mexicans | 0.1 /100 | #271 | Tragic 5.9% |
| Hispanics or Latinos | 0.0 /100 | #272 | Tragic 5.9% |
| Immigrants | Fiji | 0.0 /100 | #273 | Tragic 5.9% |
| Bahamians | 0.0 /100 | #274 | Tragic 5.9% |
| Immigrants | Latin America | 0.0 /100 | #275 | Tragic 5.9% |
| Immigrants | Central America | 0.0 /100 | #276 | Tragic 6.0% |
| Armenians | 0.0 /100 | #277 | Tragic 6.0% |
| Ghanaians | 0.0 /100 | #278 | Tragic 6.0% |
| Immigrants | Mexico | 0.0 /100 | #279 | Tragic 6.0% |
| Immigrants | Western Africa | 0.0 /100 | #280 | Tragic 6.0% |