Arab vs Immigrants from Fiji Median Female Earnings
COMPARE
Arab
Immigrants from Fiji
Median Female Earnings
Median Female Earnings Comparison
Arabs
Immigrants from Fiji
$40,718
MEDIAN FEMALE EARNINGS
89.3/ 100
METRIC RATING
134th/ 347
METRIC RANK
$41,656
MEDIAN FEMALE EARNINGS
98.3/ 100
METRIC RATING
101st/ 347
METRIC RANK
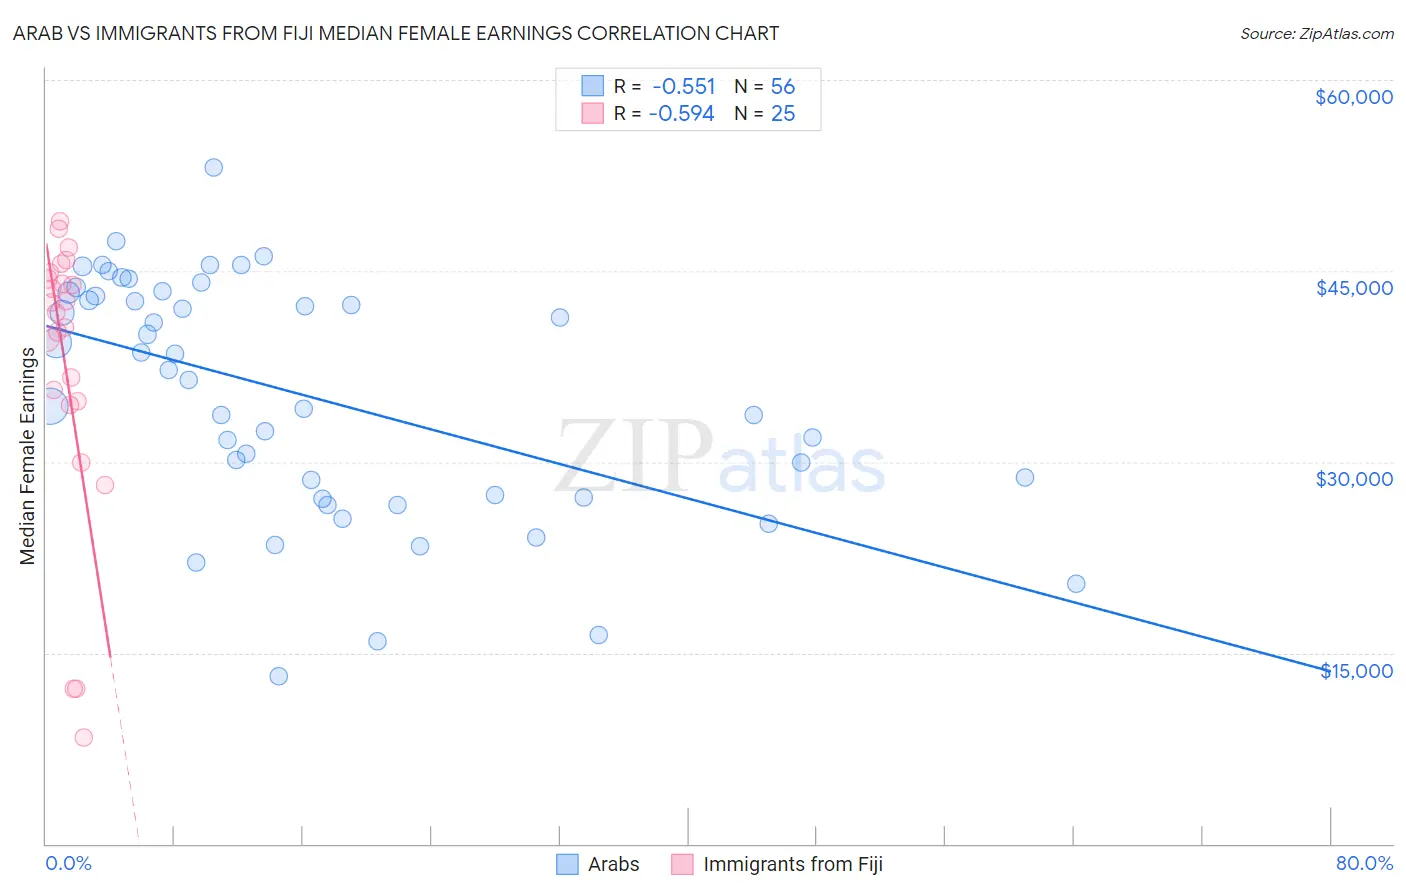
Arab vs Immigrants from Fiji Median Female Earnings Correlation Chart
The statistical analysis conducted on geographies consisting of 486,538,152 people shows a substantial negative correlation between the proportion of Arabs and median female earnings in the United States with a correlation coefficient (R) of -0.551 and weighted average of $40,718. Similarly, the statistical analysis conducted on geographies consisting of 93,750,474 people shows a substantial negative correlation between the proportion of Immigrants from Fiji and median female earnings in the United States with a correlation coefficient (R) of -0.594 and weighted average of $41,656, a difference of 2.3%.
Median Female Earnings Correlation Summary
| Measurement | Arab | Immigrants from Fiji |
| Minimum | $13,173 | $8,380 |
| Maximum | $53,122 | $48,941 |
| Range | $39,949 | $40,561 |
| Mean | $35,183 | $37,439 |
| Median | $36,815 | $41,723 |
| Interquartile 25% (IQ1) | $27,287 | $34,596 |
| Interquartile 75% (IQ3) | $43,150 | $44,642 |
| Interquartile Range (IQR) | $15,863 | $10,046 |
| Standard Deviation (Sample) | $9,334 | $11,332 |
| Standard Deviation (Population) | $9,250 | $11,103 |
Similar Demographics by Median Female Earnings
Demographics Similar to Arabs by Median Female Earnings
In terms of median female earnings, the demographic groups most similar to Arabs are Syrian ($40,727, a difference of 0.020%), Immigrants from Nepal ($40,704, a difference of 0.030%), Immigrants from Uganda ($40,739, a difference of 0.050%), Chilean ($40,757, a difference of 0.10%), and Immigrants from Guyana ($40,773, a difference of 0.14%).
| Demographics | Rating | Rank | Median Female Earnings |
| Ugandans | 92.2 /100 | #127 | Exceptional $40,889 |
| Carpatho Rusyns | 91.2 /100 | #128 | Exceptional $40,825 |
| Zimbabweans | 90.8 /100 | #129 | Exceptional $40,798 |
| Immigrants | Guyana | 90.3 /100 | #130 | Exceptional $40,773 |
| Chileans | 90.0 /100 | #131 | Exceptional $40,757 |
| Immigrants | Uganda | 89.7 /100 | #132 | Excellent $40,739 |
| Syrians | 89.5 /100 | #133 | Excellent $40,727 |
| Arabs | 89.3 /100 | #134 | Excellent $40,718 |
| Immigrants | Nepal | 89.0 /100 | #135 | Excellent $40,704 |
| Immigrants | Eastern Africa | 87.7 /100 | #136 | Excellent $40,644 |
| Pakistanis | 86.6 /100 | #137 | Excellent $40,596 |
| Taiwanese | 86.1 /100 | #138 | Excellent $40,576 |
| Immigrants | South Eastern Asia | 85.7 /100 | #139 | Excellent $40,558 |
| Serbians | 85.2 /100 | #140 | Excellent $40,539 |
| Immigrants | Syria | 84.1 /100 | #141 | Excellent $40,499 |
Demographics Similar to Immigrants from Fiji by Median Female Earnings
In terms of median female earnings, the demographic groups most similar to Immigrants from Fiji are Romanian ($41,663, a difference of 0.020%), Immigrants from Poland ($41,630, a difference of 0.060%), Immigrants from Barbados ($41,685, a difference of 0.070%), Immigrants from Argentina ($41,554, a difference of 0.25%), and Immigrants from Scotland ($41,771, a difference of 0.28%).
| Demographics | Rating | Rank | Median Female Earnings |
| Moroccans | 98.9 /100 | #94 | Exceptional $41,872 |
| Immigrants | Netherlands | 98.9 /100 | #95 | Exceptional $41,870 |
| South Africans | 98.8 /100 | #96 | Exceptional $41,825 |
| Immigrants | Hungary | 98.8 /100 | #97 | Exceptional $41,820 |
| Immigrants | Scotland | 98.7 /100 | #98 | Exceptional $41,771 |
| Immigrants | Barbados | 98.4 /100 | #99 | Exceptional $41,685 |
| Romanians | 98.3 /100 | #100 | Exceptional $41,663 |
| Immigrants | Fiji | 98.3 /100 | #101 | Exceptional $41,656 |
| Immigrants | Poland | 98.2 /100 | #102 | Exceptional $41,630 |
| Immigrants | Argentina | 97.9 /100 | #103 | Exceptional $41,554 |
| Immigrants | Zimbabwe | 97.8 /100 | #104 | Exceptional $41,527 |
| Italians | 97.7 /100 | #105 | Exceptional $41,505 |
| Immigrants | Eritrea | 97.6 /100 | #106 | Exceptional $41,485 |
| Palestinians | 97.6 /100 | #107 | Exceptional $41,484 |
| Jordanians | 97.5 /100 | #108 | Exceptional $41,464 |