Marshallese vs Immigrants from Fiji Unemployment
COMPARE
Marshallese
Immigrants from Fiji
Unemployment
Unemployment Comparison
Marshallese
Immigrants from Fiji
5.6%
UNEMPLOYMENT
1.3/ 100
METRIC RATING
243rd/ 347
METRIC RANK
5.9%
UNEMPLOYMENT
0.0/ 100
METRIC RATING
273rd/ 347
METRIC RANK
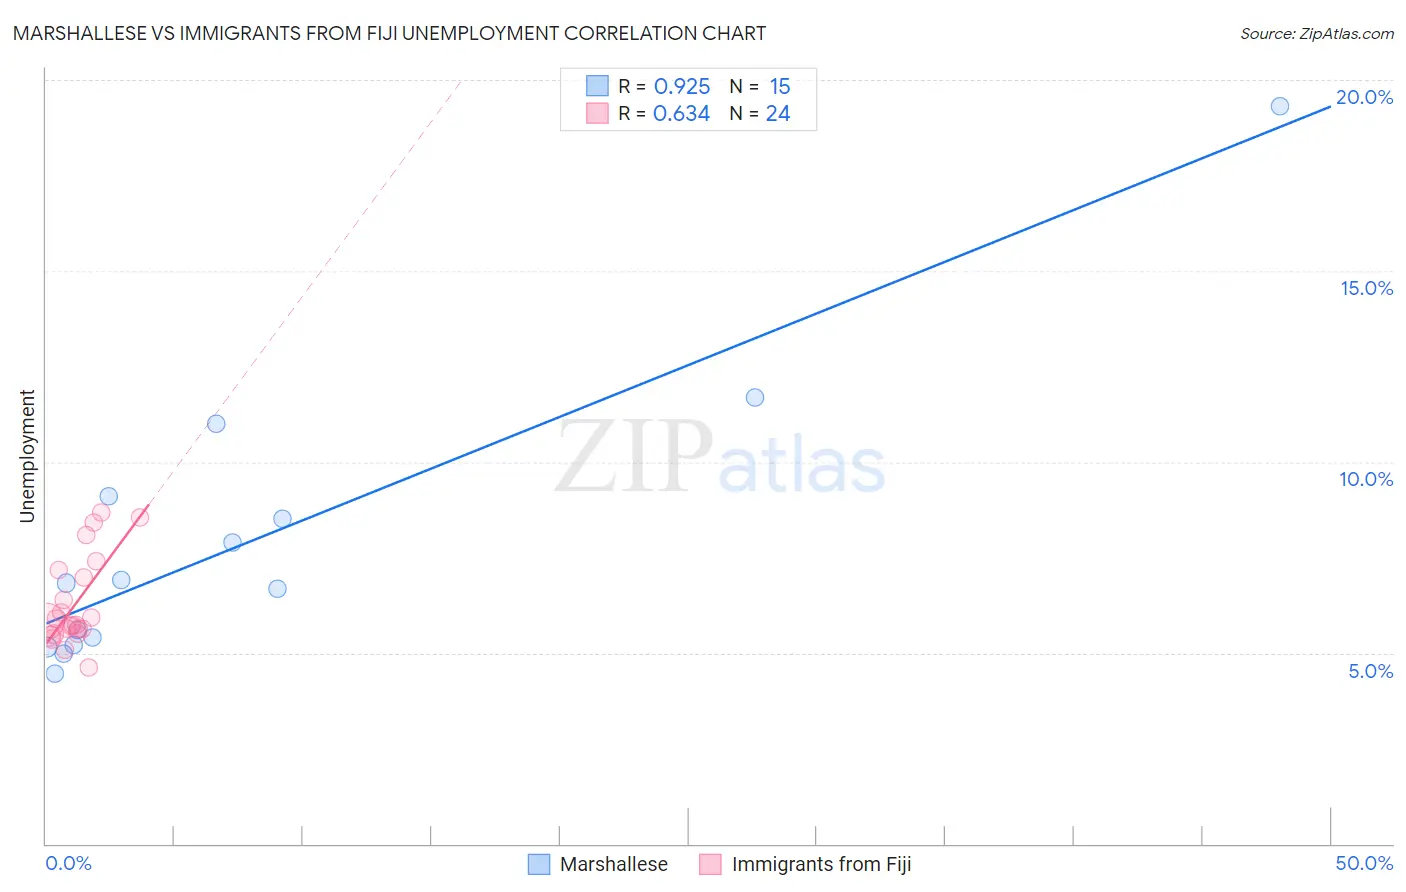
Marshallese vs Immigrants from Fiji Unemployment Correlation Chart
The statistical analysis conducted on geographies consisting of 14,759,035 people shows a near-perfect positive correlation between the proportion of Marshallese and unemployment in the United States with a correlation coefficient (R) of 0.925 and weighted average of 5.6%. Similarly, the statistical analysis conducted on geographies consisting of 93,754,040 people shows a significant positive correlation between the proportion of Immigrants from Fiji and unemployment in the United States with a correlation coefficient (R) of 0.634 and weighted average of 5.9%, a difference of 5.4%.
Unemployment Correlation Summary
| Measurement | Marshallese | Immigrants from Fiji |
| Minimum | 4.5% | 4.6% |
| Maximum | 19.3% | 8.7% |
| Range | 14.8% | 4.1% |
| Mean | 7.9% | 6.3% |
| Median | 6.8% | 5.8% |
| Interquartile 25% (IQ1) | 5.2% | 5.6% |
| Interquartile 75% (IQ3) | 9.1% | 7.1% |
| Interquartile Range (IQR) | 3.9% | 1.5% |
| Standard Deviation (Sample) | 3.8% | 1.2% |
| Standard Deviation (Population) | 3.7% | 1.1% |
Similar Demographics by Unemployment
Demographics Similar to Marshallese by Unemployment
In terms of unemployment, the demographic groups most similar to Marshallese are Dutch West Indian (5.6%, a difference of 0.15%), French American Indian (5.6%, a difference of 0.17%), Bermudan (5.6%, a difference of 0.22%), Immigrants from Cameroon (5.6%, a difference of 0.36%), and Liberian (5.6%, a difference of 0.49%).
| Demographics | Rating | Rank | Unemployment |
| Immigrants | Cambodia | 3.3 /100 | #236 | Tragic 5.5% |
| Moroccans | 3.2 /100 | #237 | Tragic 5.5% |
| Immigrants | Western Asia | 2.8 /100 | #238 | Tragic 5.5% |
| Immigrants | Immigrants | 2.6 /100 | #239 | Tragic 5.5% |
| Cree | 2.6 /100 | #240 | Tragic 5.6% |
| Tlingit-Haida | 2.0 /100 | #241 | Tragic 5.6% |
| Spanish Americans | 2.0 /100 | #242 | Tragic 5.6% |
| Marshallese | 1.3 /100 | #243 | Tragic 5.6% |
| Dutch West Indians | 1.2 /100 | #244 | Tragic 5.6% |
| French American Indians | 1.2 /100 | #245 | Tragic 5.6% |
| Bermudans | 1.1 /100 | #246 | Tragic 5.6% |
| Immigrants | Cameroon | 1.0 /100 | #247 | Tragic 5.6% |
| Liberians | 0.9 /100 | #248 | Tragic 5.6% |
| Cajuns | 0.8 /100 | #249 | Tragic 5.6% |
| Japanese | 0.8 /100 | #250 | Tragic 5.6% |
Demographics Similar to Immigrants from Fiji by Unemployment
In terms of unemployment, the demographic groups most similar to Immigrants from Fiji are Hispanic or Latino (5.9%, a difference of 0.17%), Bahamian (5.9%, a difference of 0.29%), Immigrants from Latin America (5.9%, a difference of 0.50%), Immigrants from Central America (6.0%, a difference of 0.78%), and Mexican (5.9%, a difference of 0.85%).
| Demographics | Rating | Rank | Unemployment |
| Mexican American Indians | 0.1 /100 | #266 | Tragic 5.8% |
| Immigrants | Nigeria | 0.1 /100 | #267 | Tragic 5.8% |
| Immigrants | Sierra Leone | 0.1 /100 | #268 | Tragic 5.8% |
| Immigrants | El Salvador | 0.1 /100 | #269 | Tragic 5.8% |
| Blackfeet | 0.1 /100 | #270 | Tragic 5.8% |
| Mexicans | 0.1 /100 | #271 | Tragic 5.9% |
| Hispanics or Latinos | 0.0 /100 | #272 | Tragic 5.9% |
| Immigrants | Fiji | 0.0 /100 | #273 | Tragic 5.9% |
| Bahamians | 0.0 /100 | #274 | Tragic 5.9% |
| Immigrants | Latin America | 0.0 /100 | #275 | Tragic 5.9% |
| Immigrants | Central America | 0.0 /100 | #276 | Tragic 6.0% |
| Armenians | 0.0 /100 | #277 | Tragic 6.0% |
| Ghanaians | 0.0 /100 | #278 | Tragic 6.0% |
| Immigrants | Mexico | 0.0 /100 | #279 | Tragic 6.0% |
| Immigrants | Western Africa | 0.0 /100 | #280 | Tragic 6.0% |