Arab vs French Unemployment
COMPARE
Arab
French
Unemployment
Unemployment Comparison
Arabs
French
5.3%
UNEMPLOYMENT
35.3/ 100
METRIC RATING
190th/ 347
METRIC RANK
4.8%
UNEMPLOYMENT
99.5/ 100
METRIC RATING
45th/ 347
METRIC RANK
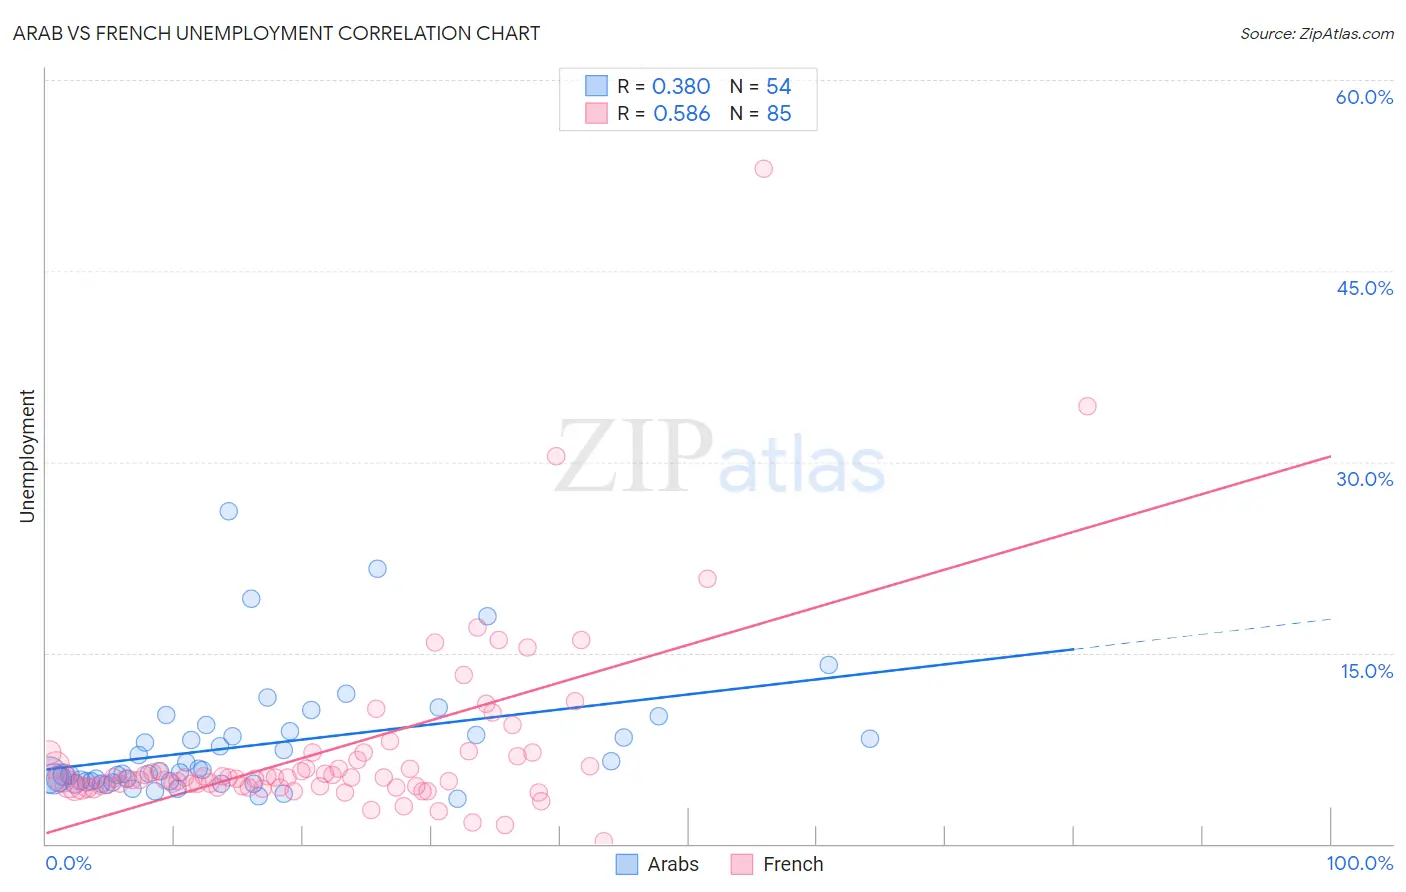
Arab vs French Unemployment Correlation Chart
The statistical analysis conducted on geographies consisting of 486,097,556 people shows a mild positive correlation between the proportion of Arabs and unemployment in the United States with a correlation coefficient (R) of 0.380 and weighted average of 5.3%. Similarly, the statistical analysis conducted on geographies consisting of 568,292,844 people shows a substantial positive correlation between the proportion of French and unemployment in the United States with a correlation coefficient (R) of 0.586 and weighted average of 4.8%, a difference of 9.7%.
Unemployment Correlation Summary
| Measurement | Arab | French |
| Minimum | 3.5% | 0.20% |
| Maximum | 26.1% | 53.0% |
| Range | 22.6% | 52.8% |
| Mean | 7.7% | 7.4% |
| Median | 5.7% | 5.2% |
| Interquartile 25% (IQ1) | 4.9% | 4.5% |
| Interquartile 75% (IQ3) | 8.5% | 7.0% |
| Interquartile Range (IQR) | 3.6% | 2.5% |
| Standard Deviation (Sample) | 4.6% | 7.3% |
| Standard Deviation (Population) | 4.6% | 7.3% |
Similar Demographics by Unemployment
Demographics Similar to Arabs by Unemployment
In terms of unemployment, the demographic groups most similar to Arabs are Immigrants from Belarus (5.3%, a difference of 0.020%), Somali (5.3%, a difference of 0.090%), South American (5.3%, a difference of 0.090%), Immigrants from Somalia (5.3%, a difference of 0.10%), and Alsatian (5.3%, a difference of 0.11%).
| Demographics | Rating | Rank | Unemployment |
| Brazilians | 40.2 /100 | #183 | Average 5.3% |
| Assyrians/Chaldeans/Syriacs | 39.2 /100 | #184 | Fair 5.3% |
| Immigrants | Thailand | 38.9 /100 | #185 | Fair 5.3% |
| Immigrants | Uganda | 37.8 /100 | #186 | Fair 5.3% |
| Costa Ricans | 37.4 /100 | #187 | Fair 5.3% |
| Alsatians | 37.0 /100 | #188 | Fair 5.3% |
| Immigrants | Belarus | 35.6 /100 | #189 | Fair 5.3% |
| Arabs | 35.3 /100 | #190 | Fair 5.3% |
| Somalis | 34.0 /100 | #191 | Fair 5.3% |
| South Americans | 33.9 /100 | #192 | Fair 5.3% |
| Immigrants | Somalia | 33.8 /100 | #193 | Fair 5.3% |
| Immigrants | Laos | 30.9 /100 | #194 | Fair 5.3% |
| Immigrants | Southern Europe | 30.9 /100 | #195 | Fair 5.3% |
| Peruvians | 29.9 /100 | #196 | Fair 5.3% |
| Immigrants | Uruguay | 29.8 /100 | #197 | Fair 5.3% |
Demographics Similar to French by Unemployment
In terms of unemployment, the demographic groups most similar to French are Austrian (4.8%, a difference of 0.050%), Yugoslavian (4.8%, a difference of 0.11%), Immigrants from Nepal (4.8%, a difference of 0.16%), Immigrants from Taiwan (4.8%, a difference of 0.18%), and Filipino (4.8%, a difference of 0.31%).
| Demographics | Rating | Rank | Unemployment |
| Bolivians | 99.7 /100 | #38 | Exceptional 4.8% |
| Lithuanians | 99.7 /100 | #39 | Exceptional 4.8% |
| Northern Europeans | 99.7 /100 | #40 | Exceptional 4.8% |
| Immigrants | Bosnia and Herzegovina | 99.7 /100 | #41 | Exceptional 4.8% |
| Filipinos | 99.5 /100 | #42 | Exceptional 4.8% |
| Yugoslavians | 99.5 /100 | #43 | Exceptional 4.8% |
| Austrians | 99.5 /100 | #44 | Exceptional 4.8% |
| French | 99.5 /100 | #45 | Exceptional 4.8% |
| Immigrants | Nepal | 99.4 /100 | #46 | Exceptional 4.8% |
| Immigrants | Taiwan | 99.4 /100 | #47 | Exceptional 4.8% |
| Immigrants | Scotland | 99.3 /100 | #48 | Exceptional 4.9% |
| Immigrants | South Central Asia | 99.3 /100 | #49 | Exceptional 4.9% |
| French Canadians | 99.3 /100 | #50 | Exceptional 4.9% |
| Immigrants | Belgium | 99.2 /100 | #51 | Exceptional 4.9% |
| Whites/Caucasians | 99.2 /100 | #52 | Exceptional 4.9% |