Arab vs Spaniard Unemployment
COMPARE
Arab
Spaniard
Unemployment
Unemployment Comparison
Arabs
Spaniards
5.3%
UNEMPLOYMENT
35.3/ 100
METRIC RATING
190th/ 347
METRIC RANK
5.3%
UNEMPLOYMENT
42.2/ 100
METRIC RATING
182nd/ 347
METRIC RANK
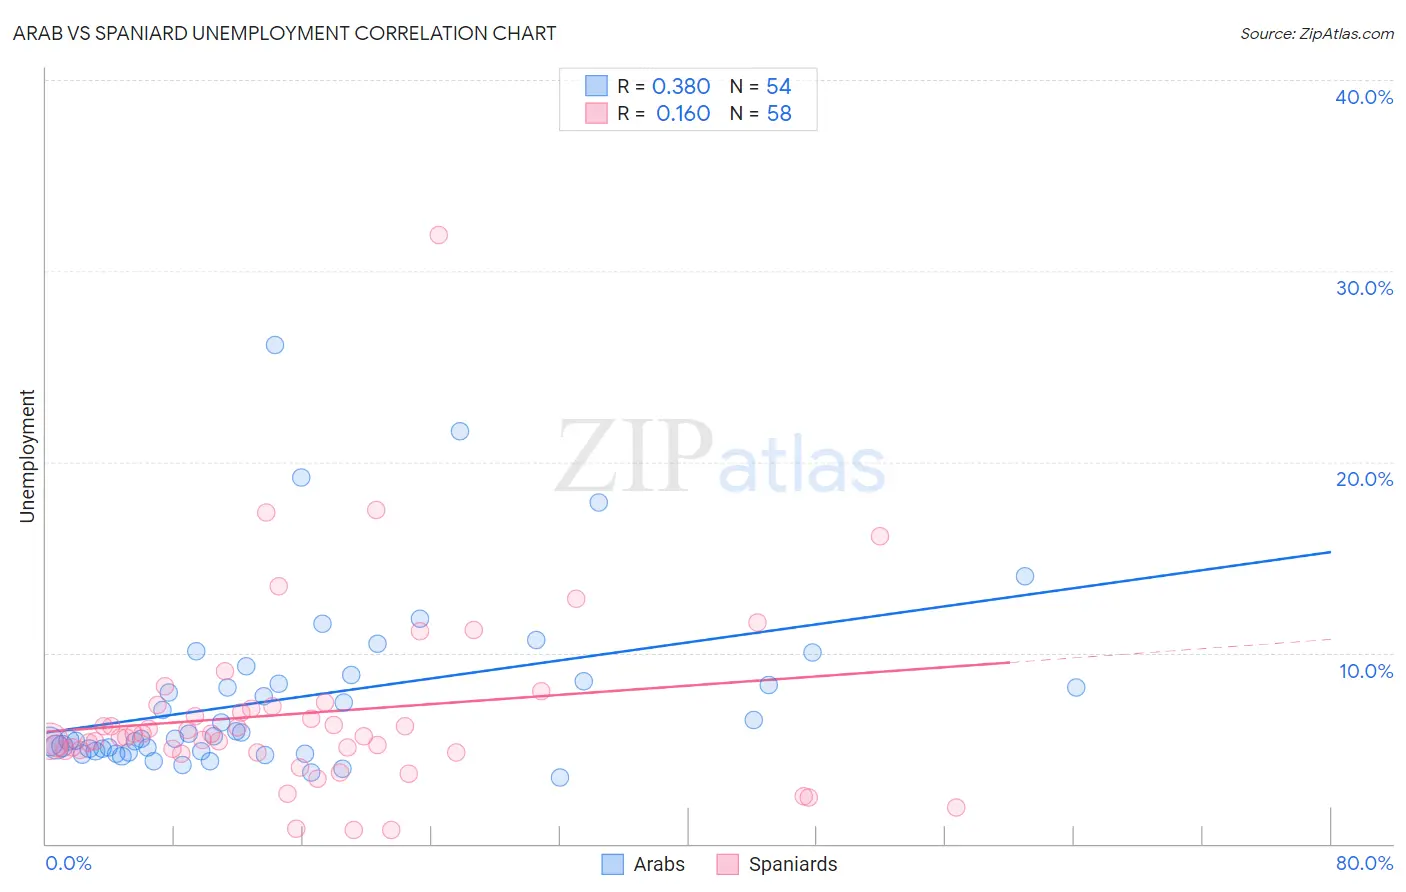
Arab vs Spaniard Unemployment Correlation Chart
The statistical analysis conducted on geographies consisting of 486,097,556 people shows a mild positive correlation between the proportion of Arabs and unemployment in the United States with a correlation coefficient (R) of 0.380 and weighted average of 5.3%. Similarly, the statistical analysis conducted on geographies consisting of 442,859,385 people shows a poor positive correlation between the proportion of Spaniards and unemployment in the United States with a correlation coefficient (R) of 0.160 and weighted average of 5.3%, a difference of 0.44%.
Unemployment Correlation Summary
| Measurement | Arab | Spaniard |
| Minimum | 3.5% | 0.70% |
| Maximum | 26.1% | 31.9% |
| Range | 22.6% | 31.2% |
| Mean | 7.7% | 6.8% |
| Median | 5.7% | 5.7% |
| Interquartile 25% (IQ1) | 4.9% | 4.9% |
| Interquartile 75% (IQ3) | 8.5% | 7.2% |
| Interquartile Range (IQR) | 3.6% | 2.3% |
| Standard Deviation (Sample) | 4.6% | 4.9% |
| Standard Deviation (Population) | 4.6% | 4.9% |
Demographics Similar to Arabs and Spaniards by Unemployment
In terms of unemployment, the demographic groups most similar to Arabs are Immigrants from Belarus (5.3%, a difference of 0.020%), Somali (5.3%, a difference of 0.090%), South American (5.3%, a difference of 0.090%), Immigrants from Somalia (5.3%, a difference of 0.10%), and Alsatian (5.3%, a difference of 0.11%). Similarly, the demographic groups most similar to Spaniards are Albanian (5.3%, a difference of 0.080%), Brazilian (5.3%, a difference of 0.13%), Immigrants from Greece (5.3%, a difference of 0.18%), Assyrian/Chaldean/Syriac (5.3%, a difference of 0.19%), and Immigrants from Thailand (5.3%, a difference of 0.21%).
| Demographics | Rating | Rank | Unemployment |
| Nicaraguans | 48.7 /100 | #176 | Average 5.3% |
| Immigrants | Nonimmigrants | 47.9 /100 | #177 | Average 5.3% |
| Afghans | 47.4 /100 | #178 | Average 5.3% |
| Malaysians | 46.8 /100 | #179 | Average 5.3% |
| Immigrants | Greece | 45.0 /100 | #180 | Average 5.3% |
| Albanians | 43.5 /100 | #181 | Average 5.3% |
| Spaniards | 42.2 /100 | #182 | Average 5.3% |
| Brazilians | 40.2 /100 | #183 | Average 5.3% |
| Assyrians/Chaldeans/Syriacs | 39.2 /100 | #184 | Fair 5.3% |
| Immigrants | Thailand | 38.9 /100 | #185 | Fair 5.3% |
| Immigrants | Uganda | 37.8 /100 | #186 | Fair 5.3% |
| Costa Ricans | 37.4 /100 | #187 | Fair 5.3% |
| Alsatians | 37.0 /100 | #188 | Fair 5.3% |
| Immigrants | Belarus | 35.6 /100 | #189 | Fair 5.3% |
| Arabs | 35.3 /100 | #190 | Fair 5.3% |
| Somalis | 34.0 /100 | #191 | Fair 5.3% |
| South Americans | 33.9 /100 | #192 | Fair 5.3% |
| Immigrants | Somalia | 33.8 /100 | #193 | Fair 5.3% |
| Immigrants | Laos | 30.9 /100 | #194 | Fair 5.3% |
| Immigrants | Southern Europe | 30.9 /100 | #195 | Fair 5.3% |
| Peruvians | 29.9 /100 | #196 | Fair 5.3% |