Immigrants from Singapore vs Immigrants from Fiji Unemployment
COMPARE
Immigrants from Singapore
Immigrants from Fiji
Unemployment
Unemployment Comparison
Immigrants from Singapore
Immigrants from Fiji
4.9%
UNEMPLOYMENT
99.1/ 100
METRIC RATING
57th/ 347
METRIC RANK
5.9%
UNEMPLOYMENT
0.0/ 100
METRIC RATING
273rd/ 347
METRIC RANK
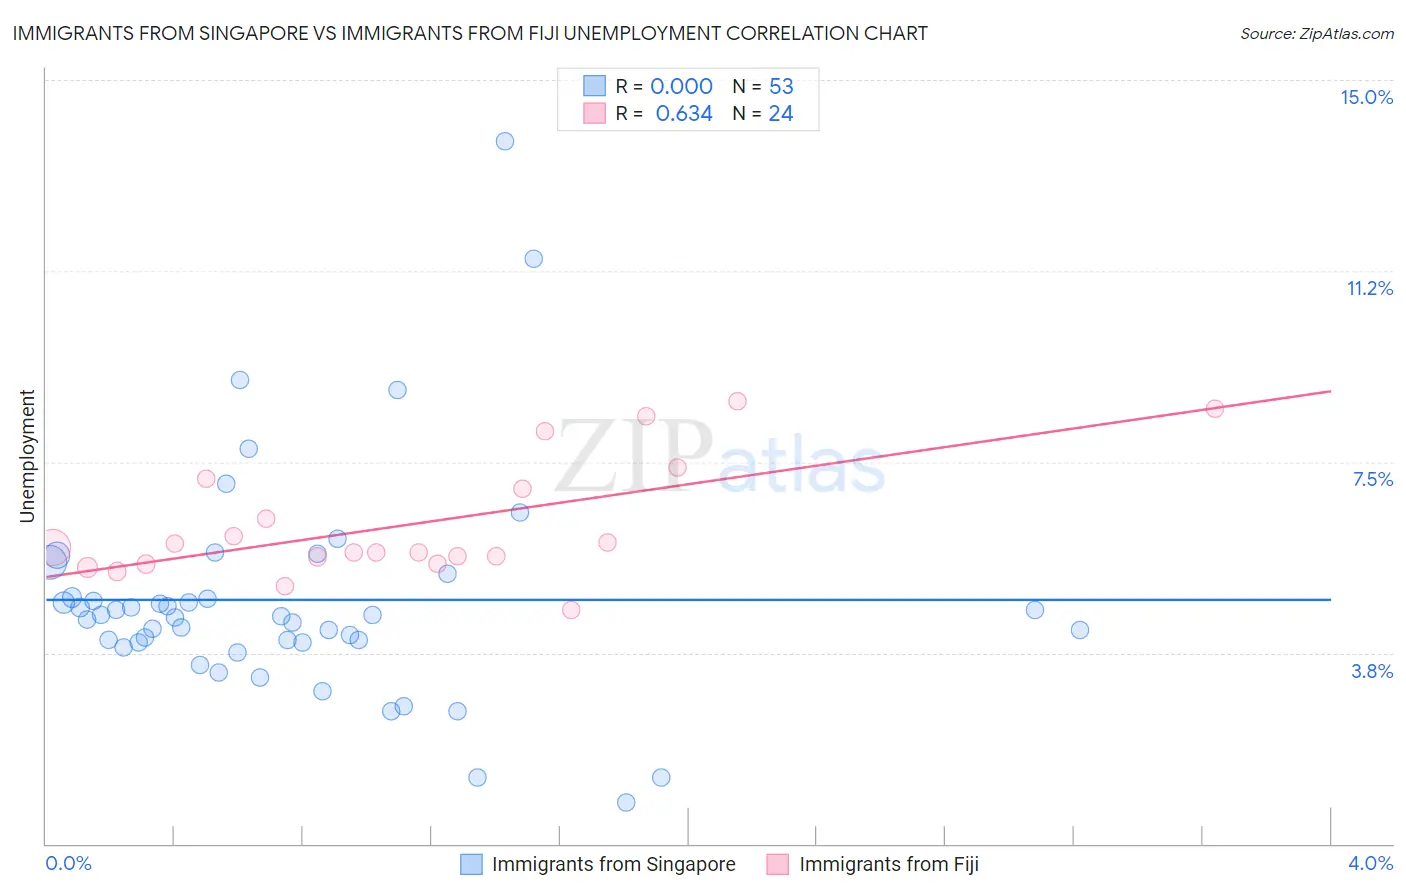
Immigrants from Singapore vs Immigrants from Fiji Unemployment Correlation Chart
The statistical analysis conducted on geographies consisting of 137,508,284 people shows no correlation between the proportion of Immigrants from Singapore and unemployment in the United States with a correlation coefficient (R) of 0.000 and weighted average of 4.9%. Similarly, the statistical analysis conducted on geographies consisting of 93,754,040 people shows a significant positive correlation between the proportion of Immigrants from Fiji and unemployment in the United States with a correlation coefficient (R) of 0.634 and weighted average of 5.9%, a difference of 21.0%.
Unemployment Correlation Summary
| Measurement | Immigrants from Singapore | Immigrants from Fiji |
| Minimum | 0.80% | 4.6% |
| Maximum | 13.8% | 8.7% |
| Range | 13.0% | 4.1% |
| Mean | 4.8% | 6.3% |
| Median | 4.5% | 5.8% |
| Interquartile 25% (IQ1) | 3.9% | 5.6% |
| Interquartile 75% (IQ3) | 5.1% | 7.1% |
| Interquartile Range (IQR) | 1.1% | 1.5% |
| Standard Deviation (Sample) | 2.2% | 1.2% |
| Standard Deviation (Population) | 2.2% | 1.1% |
Similar Demographics by Unemployment
Demographics Similar to Immigrants from Singapore by Unemployment
In terms of unemployment, the demographic groups most similar to Immigrants from Singapore are Celtic (4.9%, a difference of 0.070%), Greek (4.9%, a difference of 0.10%), Bhutanese (4.9%, a difference of 0.13%), Immigrants from Netherlands (4.9%, a difference of 0.17%), and Cambodian (4.9%, a difference of 0.17%).
| Demographics | Rating | Rank | Unemployment |
| French Canadians | 99.3 /100 | #50 | Exceptional 4.9% |
| Immigrants | Belgium | 99.2 /100 | #51 | Exceptional 4.9% |
| Whites/Caucasians | 99.2 /100 | #52 | Exceptional 4.9% |
| Immigrants | Zimbabwe | 99.2 /100 | #53 | Exceptional 4.9% |
| Eastern Europeans | 99.2 /100 | #54 | Exceptional 4.9% |
| Australians | 99.2 /100 | #55 | Exceptional 4.9% |
| Celtics | 99.1 /100 | #56 | Exceptional 4.9% |
| Immigrants | Singapore | 99.1 /100 | #57 | Exceptional 4.9% |
| Greeks | 99.0 /100 | #58 | Exceptional 4.9% |
| Bhutanese | 99.0 /100 | #59 | Exceptional 4.9% |
| Immigrants | Netherlands | 99.0 /100 | #60 | Exceptional 4.9% |
| Cambodians | 99.0 /100 | #61 | Exceptional 4.9% |
| Icelanders | 98.9 /100 | #62 | Exceptional 4.9% |
| Immigrants | Bulgaria | 98.9 /100 | #63 | Exceptional 4.9% |
| Italians | 98.9 /100 | #64 | Exceptional 4.9% |
Demographics Similar to Immigrants from Fiji by Unemployment
In terms of unemployment, the demographic groups most similar to Immigrants from Fiji are Hispanic or Latino (5.9%, a difference of 0.17%), Bahamian (5.9%, a difference of 0.29%), Immigrants from Latin America (5.9%, a difference of 0.50%), Immigrants from Central America (6.0%, a difference of 0.78%), and Mexican (5.9%, a difference of 0.85%).
| Demographics | Rating | Rank | Unemployment |
| Mexican American Indians | 0.1 /100 | #266 | Tragic 5.8% |
| Immigrants | Nigeria | 0.1 /100 | #267 | Tragic 5.8% |
| Immigrants | Sierra Leone | 0.1 /100 | #268 | Tragic 5.8% |
| Immigrants | El Salvador | 0.1 /100 | #269 | Tragic 5.8% |
| Blackfeet | 0.1 /100 | #270 | Tragic 5.8% |
| Mexicans | 0.1 /100 | #271 | Tragic 5.9% |
| Hispanics or Latinos | 0.0 /100 | #272 | Tragic 5.9% |
| Immigrants | Fiji | 0.0 /100 | #273 | Tragic 5.9% |
| Bahamians | 0.0 /100 | #274 | Tragic 5.9% |
| Immigrants | Latin America | 0.0 /100 | #275 | Tragic 5.9% |
| Immigrants | Central America | 0.0 /100 | #276 | Tragic 6.0% |
| Armenians | 0.0 /100 | #277 | Tragic 6.0% |
| Ghanaians | 0.0 /100 | #278 | Tragic 6.0% |
| Immigrants | Mexico | 0.0 /100 | #279 | Tragic 6.0% |
| Immigrants | Western Africa | 0.0 /100 | #280 | Tragic 6.0% |