Mexican vs Immigrants from Colombia Male Unemployment
COMPARE
Mexican
Immigrants from Colombia
Male Unemployment
Male Unemployment Comparison
Mexicans
Immigrants from Colombia
5.8%
MALE UNEMPLOYMENT
0.2/ 100
METRIC RATING
252nd/ 347
METRIC RANK
5.1%
MALE UNEMPLOYMENT
86.8/ 100
METRIC RATING
126th/ 347
METRIC RANK
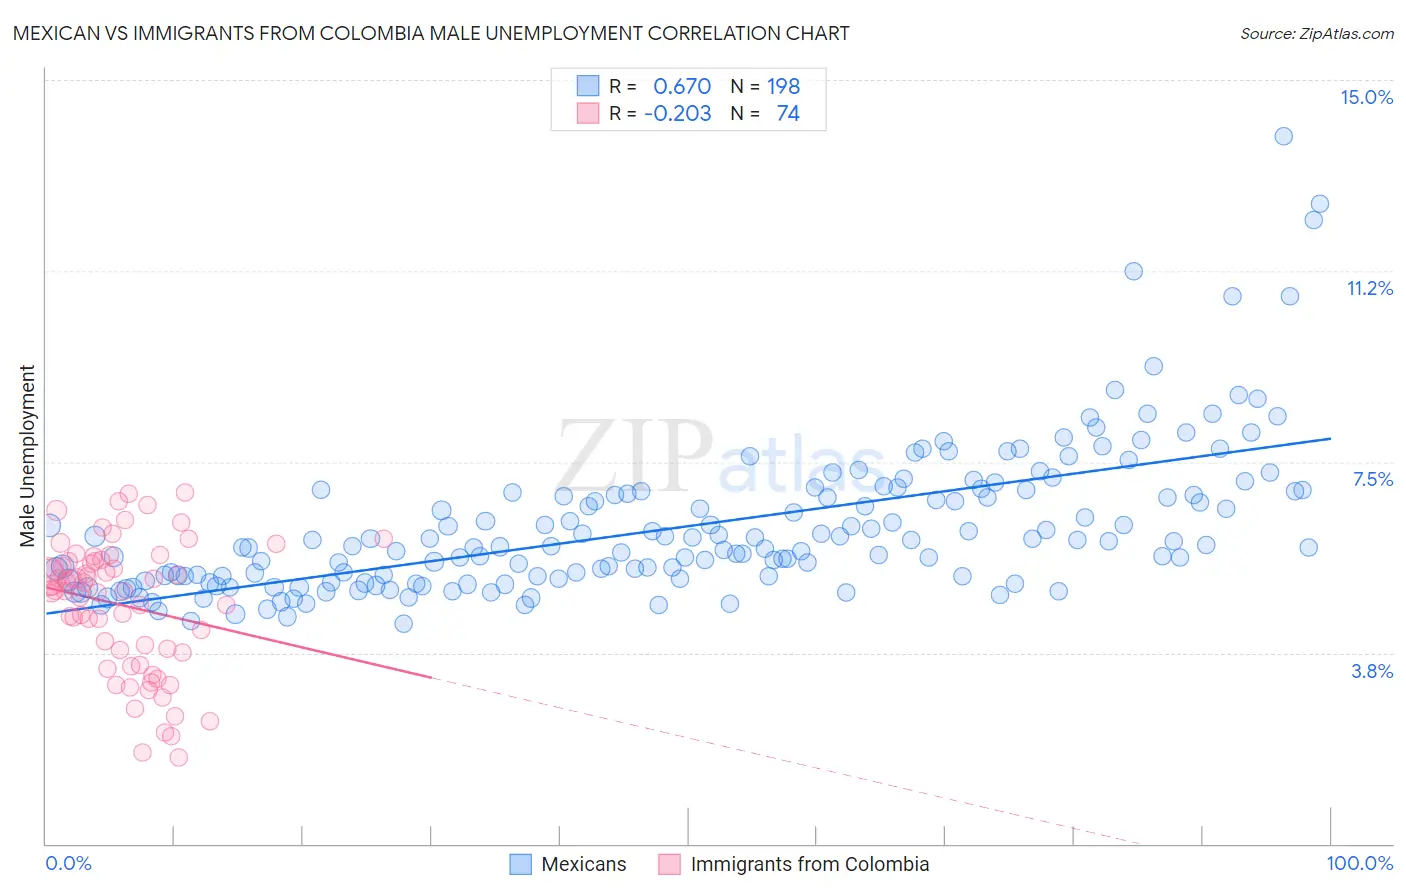
Mexican vs Immigrants from Colombia Male Unemployment Correlation Chart
The statistical analysis conducted on geographies consisting of 555,694,917 people shows a significant positive correlation between the proportion of Mexicans and unemployment rate among males in the United States with a correlation coefficient (R) of 0.670 and weighted average of 5.8%. Similarly, the statistical analysis conducted on geographies consisting of 377,439,396 people shows a weak negative correlation between the proportion of Immigrants from Colombia and unemployment rate among males in the United States with a correlation coefficient (R) of -0.203 and weighted average of 5.1%, a difference of 11.9%.
Male Unemployment Correlation Summary
| Measurement | Mexican | Immigrants from Colombia |
| Minimum | 4.3% | 1.7% |
| Maximum | 13.9% | 6.9% |
| Range | 9.6% | 5.2% |
| Mean | 6.2% | 4.7% |
| Median | 5.8% | 5.0% |
| Interquartile 25% (IQ1) | 5.2% | 3.8% |
| Interquartile 75% (IQ3) | 6.9% | 5.5% |
| Interquartile Range (IQR) | 1.7% | 1.8% |
| Standard Deviation (Sample) | 1.5% | 1.3% |
| Standard Deviation (Population) | 1.5% | 1.3% |
Similar Demographics by Male Unemployment
Demographics Similar to Mexicans by Male Unemployment
In terms of male unemployment, the demographic groups most similar to Mexicans are Mexican American Indian (5.8%, a difference of 0.13%), Japanese (5.8%, a difference of 0.30%), Kiowa (5.8%, a difference of 0.41%), Comanche (5.8%, a difference of 0.49%), and Spanish American (5.7%, a difference of 0.57%).
| Demographics | Rating | Rank | Male Unemployment |
| Yaqui | 0.7 /100 | #245 | Tragic 5.7% |
| Iroquois | 0.6 /100 | #246 | Tragic 5.7% |
| Hawaiians | 0.6 /100 | #247 | Tragic 5.7% |
| Marshallese | 0.5 /100 | #248 | Tragic 5.7% |
| Cree | 0.4 /100 | #249 | Tragic 5.7% |
| Immigrants | Bahamas | 0.4 /100 | #250 | Tragic 5.7% |
| Spanish Americans | 0.3 /100 | #251 | Tragic 5.7% |
| Mexicans | 0.2 /100 | #252 | Tragic 5.8% |
| Mexican American Indians | 0.2 /100 | #253 | Tragic 5.8% |
| Japanese | 0.2 /100 | #254 | Tragic 5.8% |
| Kiowa | 0.2 /100 | #255 | Tragic 5.8% |
| Comanche | 0.2 /100 | #256 | Tragic 5.8% |
| Hispanics or Latinos | 0.1 /100 | #257 | Tragic 5.8% |
| Dutch West Indians | 0.1 /100 | #258 | Tragic 5.8% |
| Cajuns | 0.1 /100 | #259 | Tragic 5.8% |
Demographics Similar to Immigrants from Colombia by Male Unemployment
In terms of male unemployment, the demographic groups most similar to Immigrants from Colombia are Immigrants from Lithuania (5.1%, a difference of 0.060%), Immigrants from Brazil (5.2%, a difference of 0.060%), Immigrants from Latvia (5.1%, a difference of 0.10%), Palestinian (5.1%, a difference of 0.12%), and Nicaraguan (5.1%, a difference of 0.19%).
| Demographics | Rating | Rank | Male Unemployment |
| French Canadians | 88.6 /100 | #119 | Excellent 5.1% |
| Ukrainians | 88.4 /100 | #120 | Excellent 5.1% |
| Mongolians | 88.4 /100 | #121 | Excellent 5.1% |
| Nicaraguans | 88.2 /100 | #122 | Excellent 5.1% |
| Palestinians | 87.7 /100 | #123 | Excellent 5.1% |
| Immigrants | Latvia | 87.5 /100 | #124 | Excellent 5.1% |
| Immigrants | Lithuania | 87.2 /100 | #125 | Excellent 5.1% |
| Immigrants | Colombia | 86.8 /100 | #126 | Excellent 5.1% |
| Immigrants | Brazil | 86.3 /100 | #127 | Excellent 5.2% |
| Hungarians | 85.1 /100 | #128 | Excellent 5.2% |
| Immigrants | Western Europe | 84.8 /100 | #129 | Excellent 5.2% |
| Immigrants | Malaysia | 83.5 /100 | #130 | Excellent 5.2% |
| Immigrants | Germany | 83.0 /100 | #131 | Excellent 5.2% |
| Chickasaw | 82.9 /100 | #132 | Excellent 5.2% |
| Colombians | 81.1 /100 | #133 | Excellent 5.2% |