Latvian vs Immigrants from Colombia Male Unemployment
COMPARE
Latvian
Immigrants from Colombia
Male Unemployment
Male Unemployment Comparison
Latvians
Immigrants from Colombia
4.8%
MALE UNEMPLOYMENT
99.7/ 100
METRIC RATING
33rd/ 347
METRIC RANK
5.1%
MALE UNEMPLOYMENT
86.8/ 100
METRIC RATING
126th/ 347
METRIC RANK
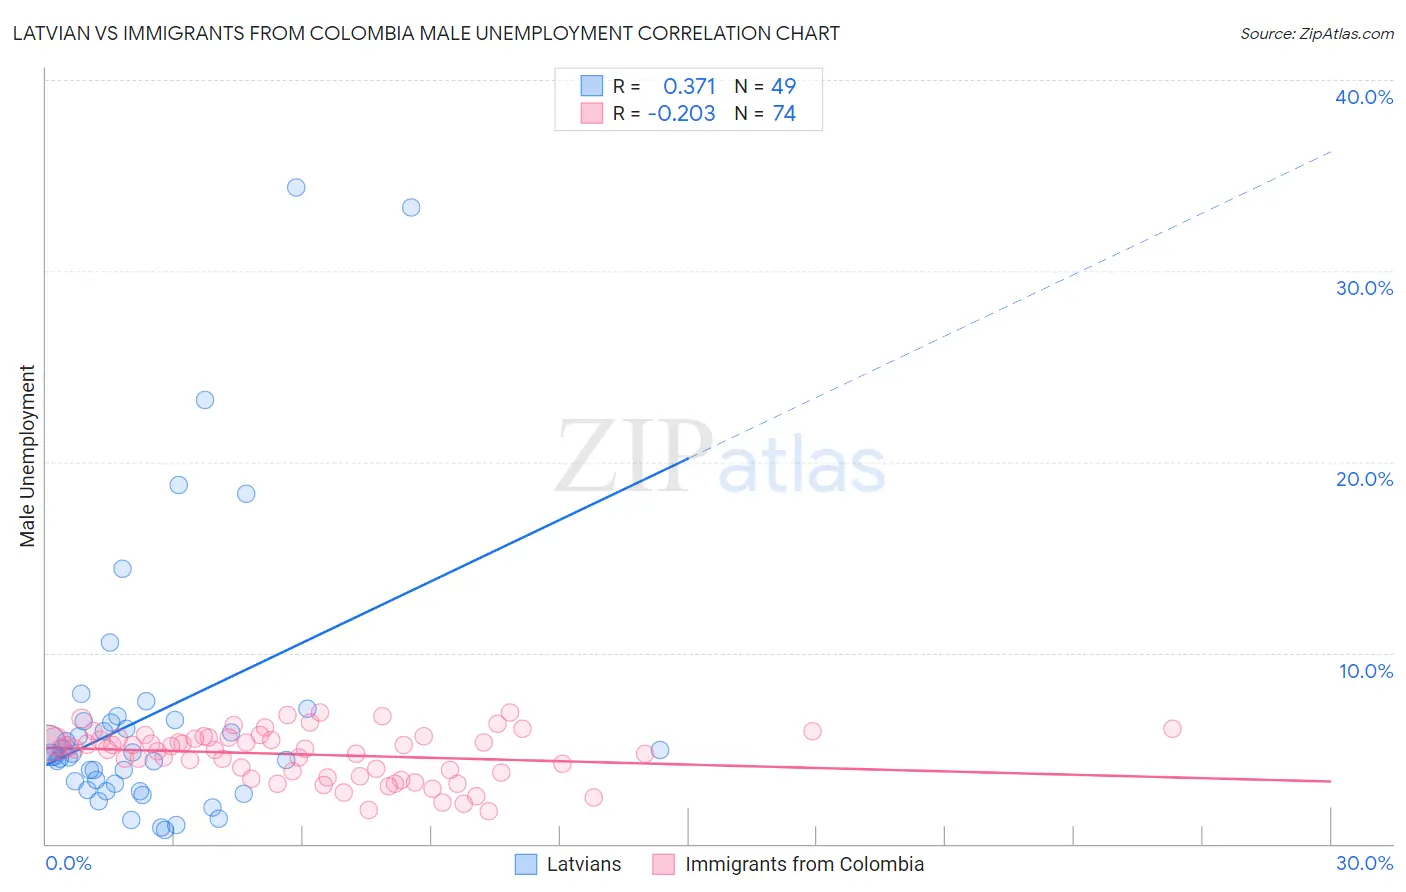
Latvian vs Immigrants from Colombia Male Unemployment Correlation Chart
The statistical analysis conducted on geographies consisting of 220,207,220 people shows a mild positive correlation between the proportion of Latvians and unemployment rate among males in the United States with a correlation coefficient (R) of 0.371 and weighted average of 4.8%. Similarly, the statistical analysis conducted on geographies consisting of 377,439,396 people shows a weak negative correlation between the proportion of Immigrants from Colombia and unemployment rate among males in the United States with a correlation coefficient (R) of -0.203 and weighted average of 5.1%, a difference of 6.3%.
Male Unemployment Correlation Summary
| Measurement | Latvian | Immigrants from Colombia |
| Minimum | 0.70% | 1.7% |
| Maximum | 34.4% | 6.9% |
| Range | 33.7% | 5.2% |
| Mean | 6.7% | 4.7% |
| Median | 4.7% | 5.0% |
| Interquartile 25% (IQ1) | 3.0% | 3.8% |
| Interquartile 75% (IQ3) | 6.5% | 5.5% |
| Interquartile Range (IQR) | 3.5% | 1.8% |
| Standard Deviation (Sample) | 7.2% | 1.3% |
| Standard Deviation (Population) | 7.2% | 1.3% |
Similar Demographics by Male Unemployment
Demographics Similar to Latvians by Male Unemployment
In terms of male unemployment, the demographic groups most similar to Latvians are Welsh (4.8%, a difference of 0.080%), Immigrants from Nepal (4.8%, a difference of 0.30%), Sudanese (4.8%, a difference of 0.31%), British (4.8%, a difference of 0.56%), and Scottish (4.8%, a difference of 0.88%).
| Demographics | Rating | Rank | Male Unemployment |
| Dutch | 99.9 /100 | #26 | Exceptional 4.8% |
| Belgians | 99.9 /100 | #27 | Exceptional 4.8% |
| Bulgarians | 99.8 /100 | #28 | Exceptional 4.8% |
| Scottish | 99.8 /100 | #29 | Exceptional 4.8% |
| British | 99.8 /100 | #30 | Exceptional 4.8% |
| Sudanese | 99.8 /100 | #31 | Exceptional 4.8% |
| Immigrants | Nepal | 99.8 /100 | #32 | Exceptional 4.8% |
| Latvians | 99.7 /100 | #33 | Exceptional 4.8% |
| Welsh | 99.7 /100 | #34 | Exceptional 4.8% |
| Paraguayans | 99.5 /100 | #35 | Exceptional 4.9% |
| Immigrants | Singapore | 99.4 /100 | #36 | Exceptional 4.9% |
| Scotch-Irish | 99.4 /100 | #37 | Exceptional 4.9% |
| Immigrants | Bosnia and Herzegovina | 99.4 /100 | #38 | Exceptional 4.9% |
| Burmese | 99.3 /100 | #39 | Exceptional 4.9% |
| Northern Europeans | 99.3 /100 | #40 | Exceptional 4.9% |
Demographics Similar to Immigrants from Colombia by Male Unemployment
In terms of male unemployment, the demographic groups most similar to Immigrants from Colombia are Immigrants from Lithuania (5.1%, a difference of 0.060%), Immigrants from Brazil (5.2%, a difference of 0.060%), Immigrants from Latvia (5.1%, a difference of 0.10%), Palestinian (5.1%, a difference of 0.12%), and Nicaraguan (5.1%, a difference of 0.19%).
| Demographics | Rating | Rank | Male Unemployment |
| French Canadians | 88.6 /100 | #119 | Excellent 5.1% |
| Ukrainians | 88.4 /100 | #120 | Excellent 5.1% |
| Mongolians | 88.4 /100 | #121 | Excellent 5.1% |
| Nicaraguans | 88.2 /100 | #122 | Excellent 5.1% |
| Palestinians | 87.7 /100 | #123 | Excellent 5.1% |
| Immigrants | Latvia | 87.5 /100 | #124 | Excellent 5.1% |
| Immigrants | Lithuania | 87.2 /100 | #125 | Excellent 5.1% |
| Immigrants | Colombia | 86.8 /100 | #126 | Excellent 5.1% |
| Immigrants | Brazil | 86.3 /100 | #127 | Excellent 5.2% |
| Hungarians | 85.1 /100 | #128 | Excellent 5.2% |
| Immigrants | Western Europe | 84.8 /100 | #129 | Excellent 5.2% |
| Immigrants | Malaysia | 83.5 /100 | #130 | Excellent 5.2% |
| Immigrants | Germany | 83.0 /100 | #131 | Excellent 5.2% |
| Chickasaw | 82.9 /100 | #132 | Excellent 5.2% |
| Colombians | 81.1 /100 | #133 | Excellent 5.2% |