Apache vs Immigrants from Colombia In Labor Force | Age 45-54
COMPARE
Apache
Immigrants from Colombia
In Labor Force | Age 45-54
In Labor Force | Age 45-54 Comparison
Apache
Immigrants from Colombia
77.1%
IN LABOR FORCE | AGE 45-54
0.0/ 100
METRIC RATING
334th/ 347
METRIC RANK
83.4%
IN LABOR FORCE | AGE 45-54
97.6/ 100
METRIC RATING
68th/ 347
METRIC RANK
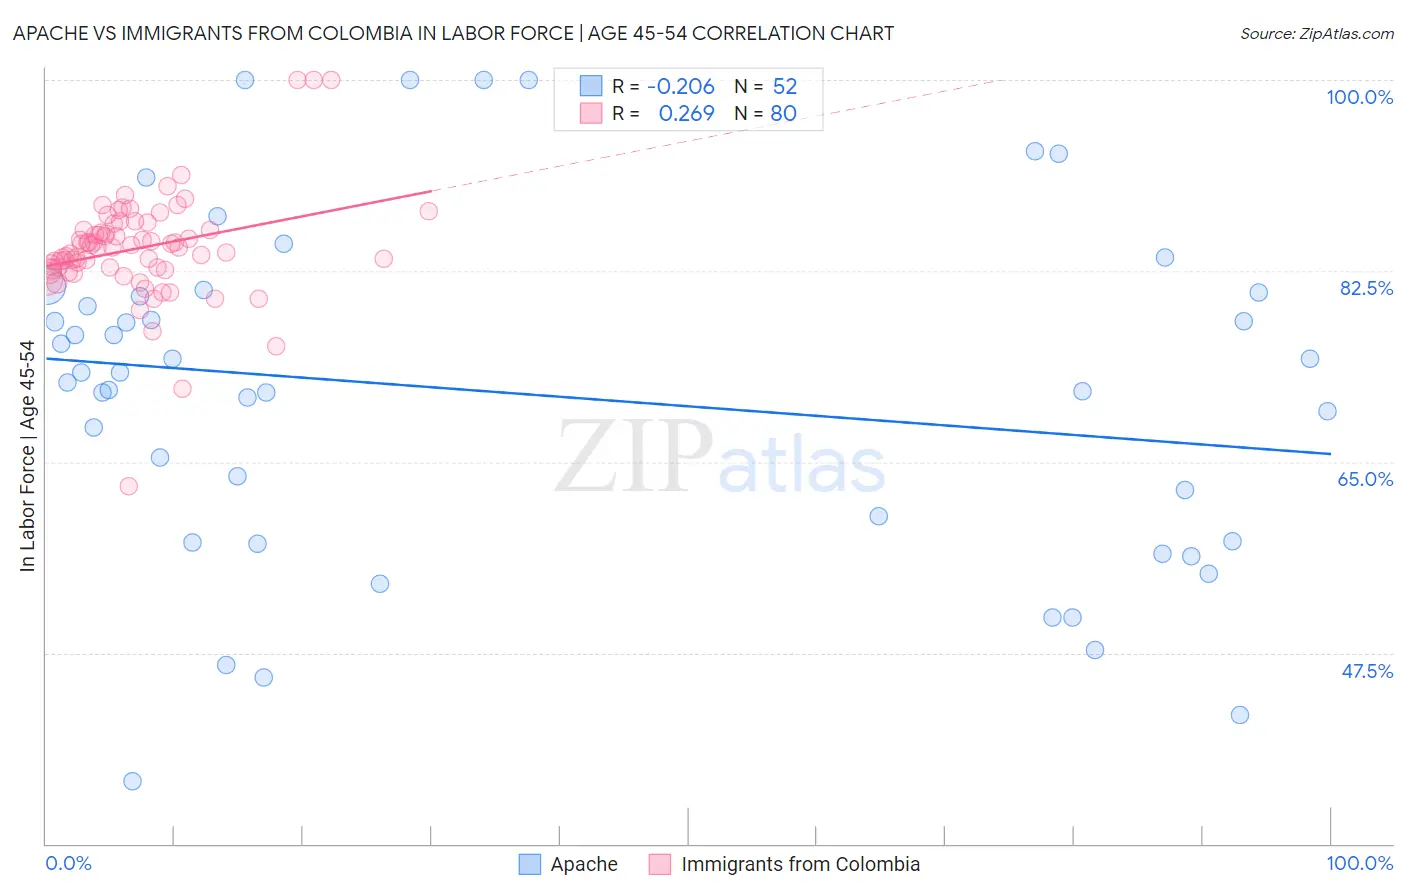
Apache vs Immigrants from Colombia In Labor Force | Age 45-54 Correlation Chart
The statistical analysis conducted on geographies consisting of 231,053,955 people shows a weak negative correlation between the proportion of Apache and labor force participation rate among population between the ages 45 and 54 in the United States with a correlation coefficient (R) of -0.206 and weighted average of 77.1%. Similarly, the statistical analysis conducted on geographies consisting of 378,524,126 people shows a weak positive correlation between the proportion of Immigrants from Colombia and labor force participation rate among population between the ages 45 and 54 in the United States with a correlation coefficient (R) of 0.269 and weighted average of 83.4%, a difference of 8.2%.
In Labor Force | Age 45-54 Correlation Summary
| Measurement | Apache | Immigrants from Colombia |
| Minimum | 35.7% | 62.7% |
| Maximum | 100.0% | 100.0% |
| Range | 64.3% | 37.3% |
| Mean | 71.2% | 84.6% |
| Median | 72.7% | 84.7% |
| Interquartile 25% (IQ1) | 57.6% | 82.7% |
| Interquartile 75% (IQ3) | 80.4% | 86.3% |
| Interquartile Range (IQR) | 22.7% | 3.6% |
| Standard Deviation (Sample) | 15.8% | 5.0% |
| Standard Deviation (Population) | 15.6% | 5.0% |
Similar Demographics by In Labor Force | Age 45-54
Demographics Similar to Apache by In Labor Force | Age 45-54
In terms of in labor force | age 45-54, the demographic groups most similar to Apache are Native/Alaskan (77.1%, a difference of 0.0%), Arapaho (77.1%, a difference of 0.070%), Menominee (77.4%, a difference of 0.36%), Tsimshian (77.4%, a difference of 0.39%), and Cheyenne (77.6%, a difference of 0.54%).
| Demographics | Rating | Rank | In Labor Force | Age 45-54 |
| Cajuns | 0.0 /100 | #327 | Tragic 78.1% |
| Sioux | 0.0 /100 | #328 | Tragic 78.0% |
| Creek | 0.0 /100 | #329 | Tragic 77.7% |
| Cheyenne | 0.0 /100 | #330 | Tragic 77.6% |
| Tsimshian | 0.0 /100 | #331 | Tragic 77.4% |
| Menominee | 0.0 /100 | #332 | Tragic 77.4% |
| Natives/Alaskans | 0.0 /100 | #333 | Tragic 77.1% |
| Apache | 0.0 /100 | #334 | Tragic 77.1% |
| Arapaho | 0.0 /100 | #335 | Tragic 77.1% |
| Paiute | 0.0 /100 | #336 | Tragic 76.7% |
| Ute | 0.0 /100 | #337 | Tragic 76.6% |
| Yuman | 0.0 /100 | #338 | Tragic 76.3% |
| Puerto Ricans | 0.0 /100 | #339 | Tragic 75.9% |
| Lumbee | 0.0 /100 | #340 | Tragic 75.6% |
| Pueblo | 0.0 /100 | #341 | Tragic 75.5% |
Demographics Similar to Immigrants from Colombia by In Labor Force | Age 45-54
In terms of in labor force | age 45-54, the demographic groups most similar to Immigrants from Colombia are Chilean (83.4%, a difference of 0.010%), Taiwanese (83.4%, a difference of 0.010%), Asian (83.4%, a difference of 0.020%), Immigrants from Latvia (83.4%, a difference of 0.020%), and Colombian (83.4%, a difference of 0.020%).
| Demographics | Rating | Rank | In Labor Force | Age 45-54 |
| Filipinos | 98.3 /100 | #61 | Exceptional 83.5% |
| Immigrants | Taiwan | 98.0 /100 | #62 | Exceptional 83.5% |
| Afghans | 97.9 /100 | #63 | Exceptional 83.5% |
| Immigrants | Kenya | 97.9 /100 | #64 | Exceptional 83.5% |
| Egyptians | 97.9 /100 | #65 | Exceptional 83.5% |
| Asians | 97.7 /100 | #66 | Exceptional 83.4% |
| Chileans | 97.7 /100 | #67 | Exceptional 83.4% |
| Immigrants | Colombia | 97.6 /100 | #68 | Exceptional 83.4% |
| Taiwanese | 97.5 /100 | #69 | Exceptional 83.4% |
| Immigrants | Latvia | 97.4 /100 | #70 | Exceptional 83.4% |
| Colombians | 97.3 /100 | #71 | Exceptional 83.4% |
| Serbians | 97.2 /100 | #72 | Exceptional 83.4% |
| Immigrants | Czechoslovakia | 97.1 /100 | #73 | Exceptional 83.4% |
| Immigrants | Somalia | 96.9 /100 | #74 | Exceptional 83.4% |
| Estonians | 96.9 /100 | #75 | Exceptional 83.4% |