Hopi vs Immigrants from Bolivia Male Unemployment
COMPARE
Hopi
Immigrants from Bolivia
Male Unemployment
Male Unemployment Comparison
Hopi
Immigrants from Bolivia
10.8%
MALE UNEMPLOYMENT
0.0/ 100
METRIC RATING
344th/ 347
METRIC RANK
4.7%
MALE UNEMPLOYMENT
100.0/ 100
METRIC RATING
12th/ 347
METRIC RANK
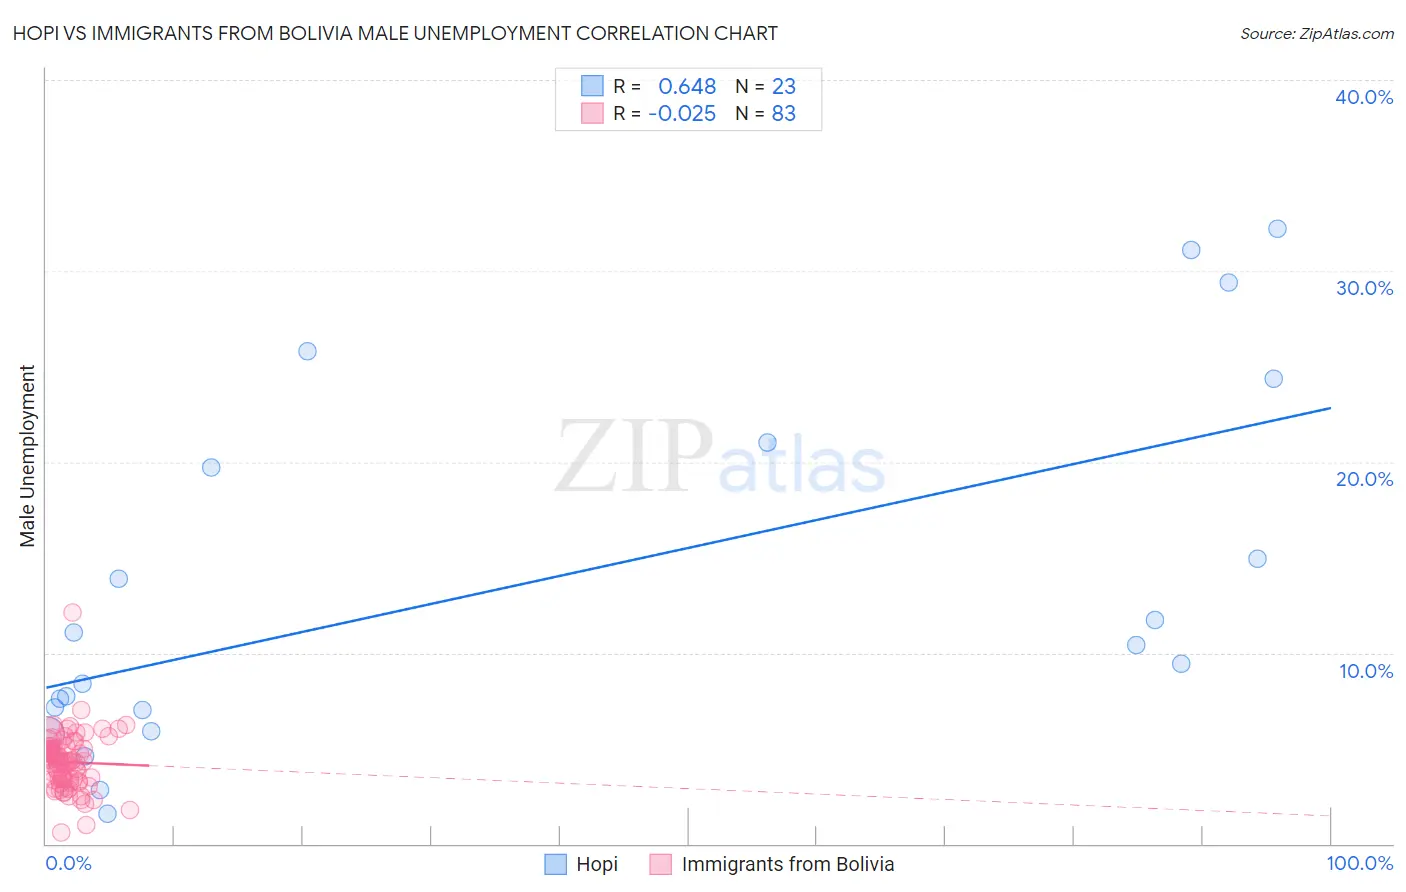
Hopi vs Immigrants from Bolivia Male Unemployment Correlation Chart
The statistical analysis conducted on geographies consisting of 74,646,198 people shows a significant positive correlation between the proportion of Hopi and unemployment rate among males in the United States with a correlation coefficient (R) of 0.648 and weighted average of 10.8%. Similarly, the statistical analysis conducted on geographies consisting of 158,566,605 people shows no correlation between the proportion of Immigrants from Bolivia and unemployment rate among males in the United States with a correlation coefficient (R) of -0.025 and weighted average of 4.7%, a difference of 131.4%.
Male Unemployment Correlation Summary
| Measurement | Hopi | Immigrants from Bolivia |
| Minimum | 1.6% | 0.60% |
| Maximum | 32.2% | 12.1% |
| Range | 30.6% | 11.5% |
| Mean | 13.6% | 4.3% |
| Median | 10.4% | 4.3% |
| Interquartile 25% (IQ1) | 7.0% | 3.4% |
| Interquartile 75% (IQ3) | 21.0% | 5.0% |
| Interquartile Range (IQR) | 14.0% | 1.7% |
| Standard Deviation (Sample) | 9.4% | 1.5% |
| Standard Deviation (Population) | 9.2% | 1.5% |
Similar Demographics by Male Unemployment
Demographics Similar to Hopi by Male Unemployment
In terms of male unemployment, the demographic groups most similar to Hopi are Crow (10.6%, a difference of 1.7%), Arapaho (11.0%, a difference of 2.0%), Tohono O'odham (10.2%, a difference of 6.1%), Navajo (9.8%, a difference of 9.7%), and Alaskan Athabascan (9.8%, a difference of 10.0%).
| Demographics | Rating | Rank | Male Unemployment |
| Sioux | 0.0 /100 | #333 | Tragic 8.4% |
| Tsimshian | 0.0 /100 | #334 | Tragic 8.5% |
| Pueblo | 0.0 /100 | #335 | Tragic 8.5% |
| Yuman | 0.0 /100 | #336 | Tragic 8.6% |
| Puerto Ricans | 0.0 /100 | #337 | Tragic 8.6% |
| Apache | 0.0 /100 | #338 | Tragic 8.6% |
| Cheyenne | 0.0 /100 | #339 | Tragic 9.8% |
| Alaskan Athabascans | 0.0 /100 | #340 | Tragic 9.8% |
| Navajo | 0.0 /100 | #341 | Tragic 9.8% |
| Tohono O'odham | 0.0 /100 | #342 | Tragic 10.2% |
| Crow | 0.0 /100 | #343 | Tragic 10.6% |
| Hopi | 0.0 /100 | #344 | Tragic 10.8% |
| Arapaho | 0.0 /100 | #345 | Tragic 11.0% |
| Inupiat | 0.0 /100 | #346 | Tragic 12.1% |
| Yup'ik | 0.0 /100 | #347 | Tragic 16.4% |
Demographics Similar to Immigrants from Bolivia by Male Unemployment
In terms of male unemployment, the demographic groups most similar to Immigrants from Bolivia are Bolivian (4.7%, a difference of 0.68%), German (4.7%, a difference of 0.70%), Swedish (4.6%, a difference of 0.73%), Cuban (4.6%, a difference of 0.93%), and Scandinavian (4.7%, a difference of 0.97%).
| Demographics | Rating | Rank | Male Unemployment |
| Danes | 100.0 /100 | #5 | Exceptional 4.5% |
| Venezuelans | 100.0 /100 | #6 | Exceptional 4.5% |
| Czechs | 100.0 /100 | #7 | Exceptional 4.5% |
| Luxembourgers | 100.0 /100 | #8 | Exceptional 4.5% |
| Thais | 100.0 /100 | #9 | Exceptional 4.6% |
| Cubans | 100.0 /100 | #10 | Exceptional 4.6% |
| Swedes | 100.0 /100 | #11 | Exceptional 4.6% |
| Immigrants | Bolivia | 100.0 /100 | #12 | Exceptional 4.7% |
| Bolivians | 100.0 /100 | #13 | Exceptional 4.7% |
| Germans | 100.0 /100 | #14 | Exceptional 4.7% |
| Scandinavians | 100.0 /100 | #15 | Exceptional 4.7% |
| Swiss | 99.9 /100 | #16 | Exceptional 4.7% |
| Filipinos | 99.9 /100 | #17 | Exceptional 4.7% |
| English | 99.9 /100 | #18 | Exceptional 4.8% |
| Europeans | 99.9 /100 | #19 | Exceptional 4.8% |