Syrian vs Immigrants from Bolivia Male Unemployment
COMPARE
Syrian
Immigrants from Bolivia
Male Unemployment
Male Unemployment Comparison
Syrians
Immigrants from Bolivia
5.2%
MALE UNEMPLOYMENT
78.0/ 100
METRIC RATING
143rd/ 347
METRIC RANK
4.7%
MALE UNEMPLOYMENT
100.0/ 100
METRIC RATING
12th/ 347
METRIC RANK
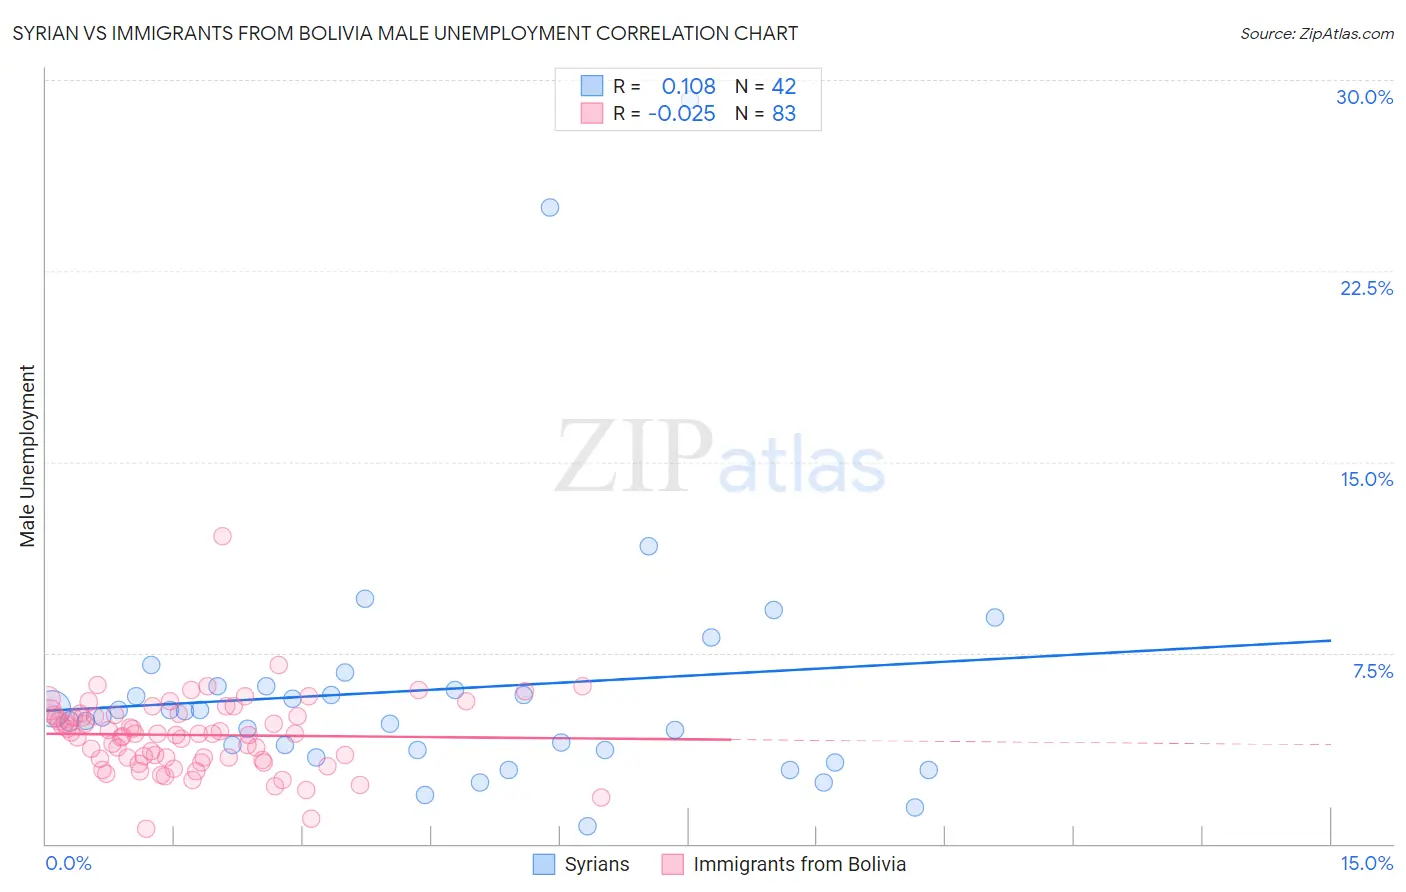
Syrian vs Immigrants from Bolivia Male Unemployment Correlation Chart
The statistical analysis conducted on geographies consisting of 265,748,464 people shows a poor positive correlation between the proportion of Syrians and unemployment rate among males in the United States with a correlation coefficient (R) of 0.108 and weighted average of 5.2%. Similarly, the statistical analysis conducted on geographies consisting of 158,566,605 people shows no correlation between the proportion of Immigrants from Bolivia and unemployment rate among males in the United States with a correlation coefficient (R) of -0.025 and weighted average of 4.7%, a difference of 11.5%.
Male Unemployment Correlation Summary
| Measurement | Syrian | Immigrants from Bolivia |
| Minimum | 0.70% | 0.60% |
| Maximum | 29.2% | 12.1% |
| Range | 28.5% | 11.5% |
| Mean | 6.1% | 4.3% |
| Median | 5.1% | 4.3% |
| Interquartile 25% (IQ1) | 3.7% | 3.4% |
| Interquartile 75% (IQ3) | 6.2% | 5.0% |
| Interquartile Range (IQR) | 2.5% | 1.7% |
| Standard Deviation (Sample) | 5.3% | 1.5% |
| Standard Deviation (Population) | 5.2% | 1.5% |
Similar Demographics by Male Unemployment
Demographics Similar to Syrians by Male Unemployment
In terms of male unemployment, the demographic groups most similar to Syrians are Sri Lankan (5.2%, a difference of 0.010%), Macedonian (5.2%, a difference of 0.020%), Fijian (5.2%, a difference of 0.030%), Immigrants from Kenya (5.2%, a difference of 0.030%), and Immigrants from Burma/Myanmar (5.2%, a difference of 0.040%).
| Demographics | Rating | Rank | Male Unemployment |
| Lebanese | 79.9 /100 | #136 | Good 5.2% |
| Immigrants | Eastern Africa | 79.8 /100 | #137 | Good 5.2% |
| Immigrants | Croatia | 79.7 /100 | #138 | Good 5.2% |
| Kenyans | 79.4 /100 | #139 | Good 5.2% |
| Brazilians | 79.3 /100 | #140 | Good 5.2% |
| Immigrants | Switzerland | 79.2 /100 | #141 | Good 5.2% |
| Fijians | 78.3 /100 | #142 | Good 5.2% |
| Syrians | 78.0 /100 | #143 | Good 5.2% |
| Sri Lankans | 77.9 /100 | #144 | Good 5.2% |
| Macedonians | 77.7 /100 | #145 | Good 5.2% |
| Immigrants | Kenya | 77.6 /100 | #146 | Good 5.2% |
| Immigrants | Burma/Myanmar | 77.5 /100 | #147 | Good 5.2% |
| Immigrants | Italy | 76.3 /100 | #148 | Good 5.2% |
| Immigrants | Europe | 76.2 /100 | #149 | Good 5.2% |
| Indians (Asian) | 76.0 /100 | #150 | Good 5.2% |
Demographics Similar to Immigrants from Bolivia by Male Unemployment
In terms of male unemployment, the demographic groups most similar to Immigrants from Bolivia are Bolivian (4.7%, a difference of 0.68%), German (4.7%, a difference of 0.70%), Swedish (4.6%, a difference of 0.73%), Cuban (4.6%, a difference of 0.93%), and Scandinavian (4.7%, a difference of 0.97%).
| Demographics | Rating | Rank | Male Unemployment |
| Danes | 100.0 /100 | #5 | Exceptional 4.5% |
| Venezuelans | 100.0 /100 | #6 | Exceptional 4.5% |
| Czechs | 100.0 /100 | #7 | Exceptional 4.5% |
| Luxembourgers | 100.0 /100 | #8 | Exceptional 4.5% |
| Thais | 100.0 /100 | #9 | Exceptional 4.6% |
| Cubans | 100.0 /100 | #10 | Exceptional 4.6% |
| Swedes | 100.0 /100 | #11 | Exceptional 4.6% |
| Immigrants | Bolivia | 100.0 /100 | #12 | Exceptional 4.7% |
| Bolivians | 100.0 /100 | #13 | Exceptional 4.7% |
| Germans | 100.0 /100 | #14 | Exceptional 4.7% |
| Scandinavians | 100.0 /100 | #15 | Exceptional 4.7% |
| Swiss | 99.9 /100 | #16 | Exceptional 4.7% |
| Filipinos | 99.9 /100 | #17 | Exceptional 4.7% |
| English | 99.9 /100 | #18 | Exceptional 4.8% |
| Europeans | 99.9 /100 | #19 | Exceptional 4.8% |