Cambodian vs Immigrants from Bolivia Male Unemployment
COMPARE
Cambodian
Immigrants from Bolivia
Male Unemployment
Male Unemployment Comparison
Cambodians
Immigrants from Bolivia
5.0%
MALE UNEMPLOYMENT
98.1/ 100
METRIC RATING
61st/ 347
METRIC RANK
4.7%
MALE UNEMPLOYMENT
100.0/ 100
METRIC RATING
12th/ 347
METRIC RANK
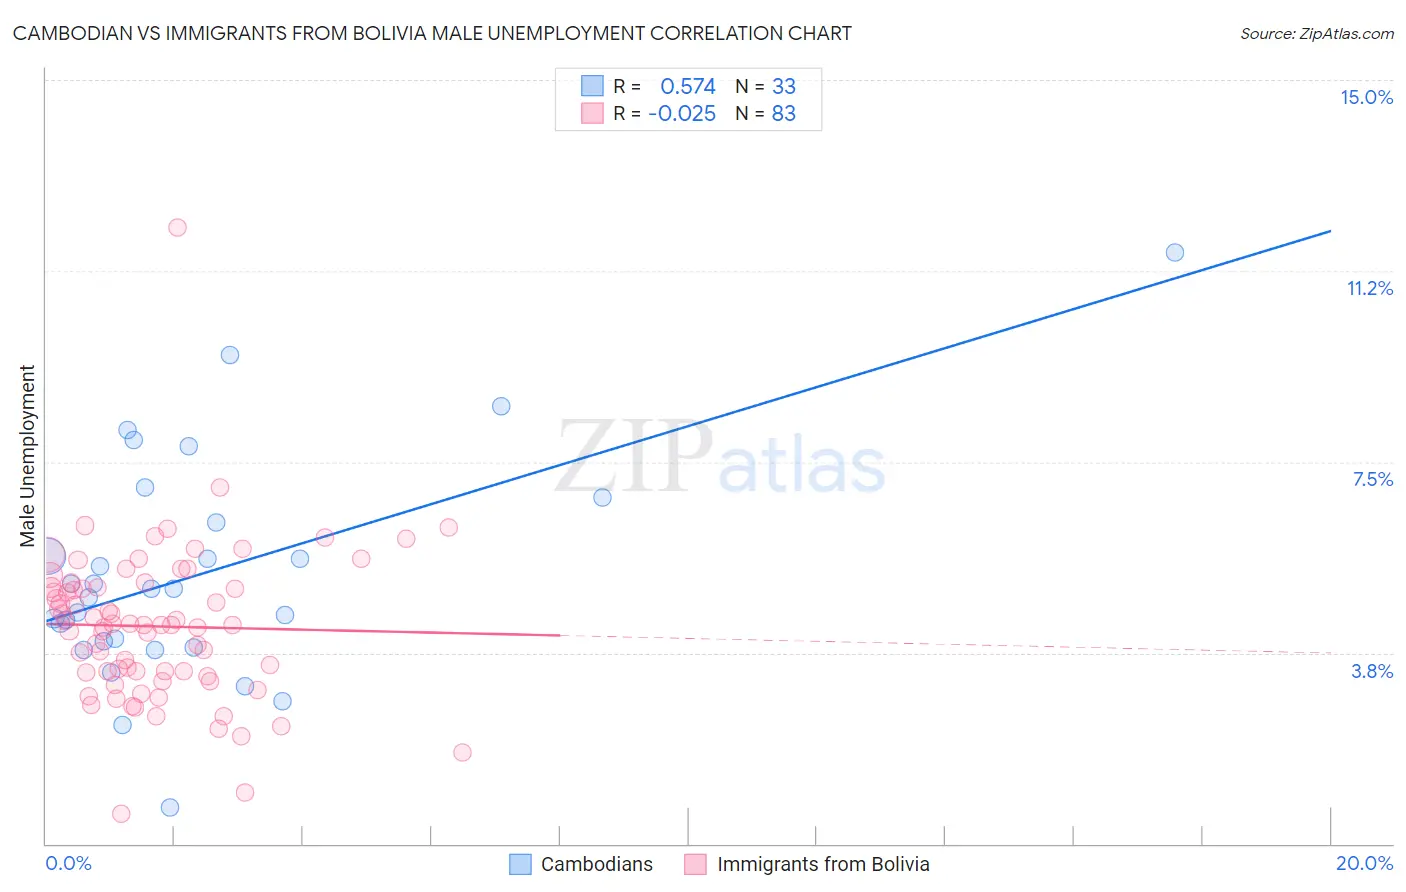
Cambodian vs Immigrants from Bolivia Male Unemployment Correlation Chart
The statistical analysis conducted on geographies consisting of 102,427,850 people shows a substantial positive correlation between the proportion of Cambodians and unemployment rate among males in the United States with a correlation coefficient (R) of 0.574 and weighted average of 5.0%. Similarly, the statistical analysis conducted on geographies consisting of 158,566,605 people shows no correlation between the proportion of Immigrants from Bolivia and unemployment rate among males in the United States with a correlation coefficient (R) of -0.025 and weighted average of 4.7%, a difference of 7.1%.
Male Unemployment Correlation Summary
| Measurement | Cambodian | Immigrants from Bolivia |
| Minimum | 0.70% | 0.60% |
| Maximum | 11.6% | 12.1% |
| Range | 10.9% | 11.5% |
| Mean | 5.3% | 4.3% |
| Median | 5.0% | 4.3% |
| Interquartile 25% (IQ1) | 3.9% | 3.4% |
| Interquartile 75% (IQ3) | 6.6% | 5.0% |
| Interquartile Range (IQR) | 2.6% | 1.7% |
| Standard Deviation (Sample) | 2.2% | 1.5% |
| Standard Deviation (Population) | 2.2% | 1.5% |
Similar Demographics by Male Unemployment
Demographics Similar to Cambodians by Male Unemployment
In terms of male unemployment, the demographic groups most similar to Cambodians are Immigrants from Argentina (5.0%, a difference of 0.080%), Basque (5.0%, a difference of 0.13%), Eastern European (5.0%, a difference of 0.14%), Celtic (5.0%, a difference of 0.16%), and Immigrants from Netherlands (5.0%, a difference of 0.26%).
| Demographics | Rating | Rank | Male Unemployment |
| Yugoslavians | 98.7 /100 | #54 | Exceptional 5.0% |
| Czechoslovakians | 98.7 /100 | #55 | Exceptional 5.0% |
| Immigrants | Bulgaria | 98.7 /100 | #56 | Exceptional 5.0% |
| Turks | 98.5 /100 | #57 | Exceptional 5.0% |
| Lithuanians | 98.5 /100 | #58 | Exceptional 5.0% |
| Immigrants | Netherlands | 98.3 /100 | #59 | Exceptional 5.0% |
| Immigrants | Argentina | 98.1 /100 | #60 | Exceptional 5.0% |
| Cambodians | 98.1 /100 | #61 | Exceptional 5.0% |
| Basques | 97.9 /100 | #62 | Exceptional 5.0% |
| Eastern Europeans | 97.9 /100 | #63 | Exceptional 5.0% |
| Celtics | 97.8 /100 | #64 | Exceptional 5.0% |
| Icelanders | 97.6 /100 | #65 | Exceptional 5.0% |
| Finns | 97.5 /100 | #66 | Exceptional 5.0% |
| Immigrants | Canada | 97.5 /100 | #67 | Exceptional 5.0% |
| Australians | 97.4 /100 | #68 | Exceptional 5.0% |
Demographics Similar to Immigrants from Bolivia by Male Unemployment
In terms of male unemployment, the demographic groups most similar to Immigrants from Bolivia are Bolivian (4.7%, a difference of 0.68%), German (4.7%, a difference of 0.70%), Swedish (4.6%, a difference of 0.73%), Cuban (4.6%, a difference of 0.93%), and Scandinavian (4.7%, a difference of 0.97%).
| Demographics | Rating | Rank | Male Unemployment |
| Danes | 100.0 /100 | #5 | Exceptional 4.5% |
| Venezuelans | 100.0 /100 | #6 | Exceptional 4.5% |
| Czechs | 100.0 /100 | #7 | Exceptional 4.5% |
| Luxembourgers | 100.0 /100 | #8 | Exceptional 4.5% |
| Thais | 100.0 /100 | #9 | Exceptional 4.6% |
| Cubans | 100.0 /100 | #10 | Exceptional 4.6% |
| Swedes | 100.0 /100 | #11 | Exceptional 4.6% |
| Immigrants | Bolivia | 100.0 /100 | #12 | Exceptional 4.7% |
| Bolivians | 100.0 /100 | #13 | Exceptional 4.7% |
| Germans | 100.0 /100 | #14 | Exceptional 4.7% |
| Scandinavians | 100.0 /100 | #15 | Exceptional 4.7% |
| Swiss | 99.9 /100 | #16 | Exceptional 4.7% |
| Filipinos | 99.9 /100 | #17 | Exceptional 4.7% |
| English | 99.9 /100 | #18 | Exceptional 4.8% |
| Europeans | 99.9 /100 | #19 | Exceptional 4.8% |