Slavic vs Immigrants from Bolivia Male Unemployment
COMPARE
Slavic
Immigrants from Bolivia
Male Unemployment
Male Unemployment Comparison
Slavs
Immigrants from Bolivia
5.1%
MALE UNEMPLOYMENT
94.2/ 100
METRIC RATING
92nd/ 347
METRIC RANK
4.7%
MALE UNEMPLOYMENT
100.0/ 100
METRIC RATING
12th/ 347
METRIC RANK
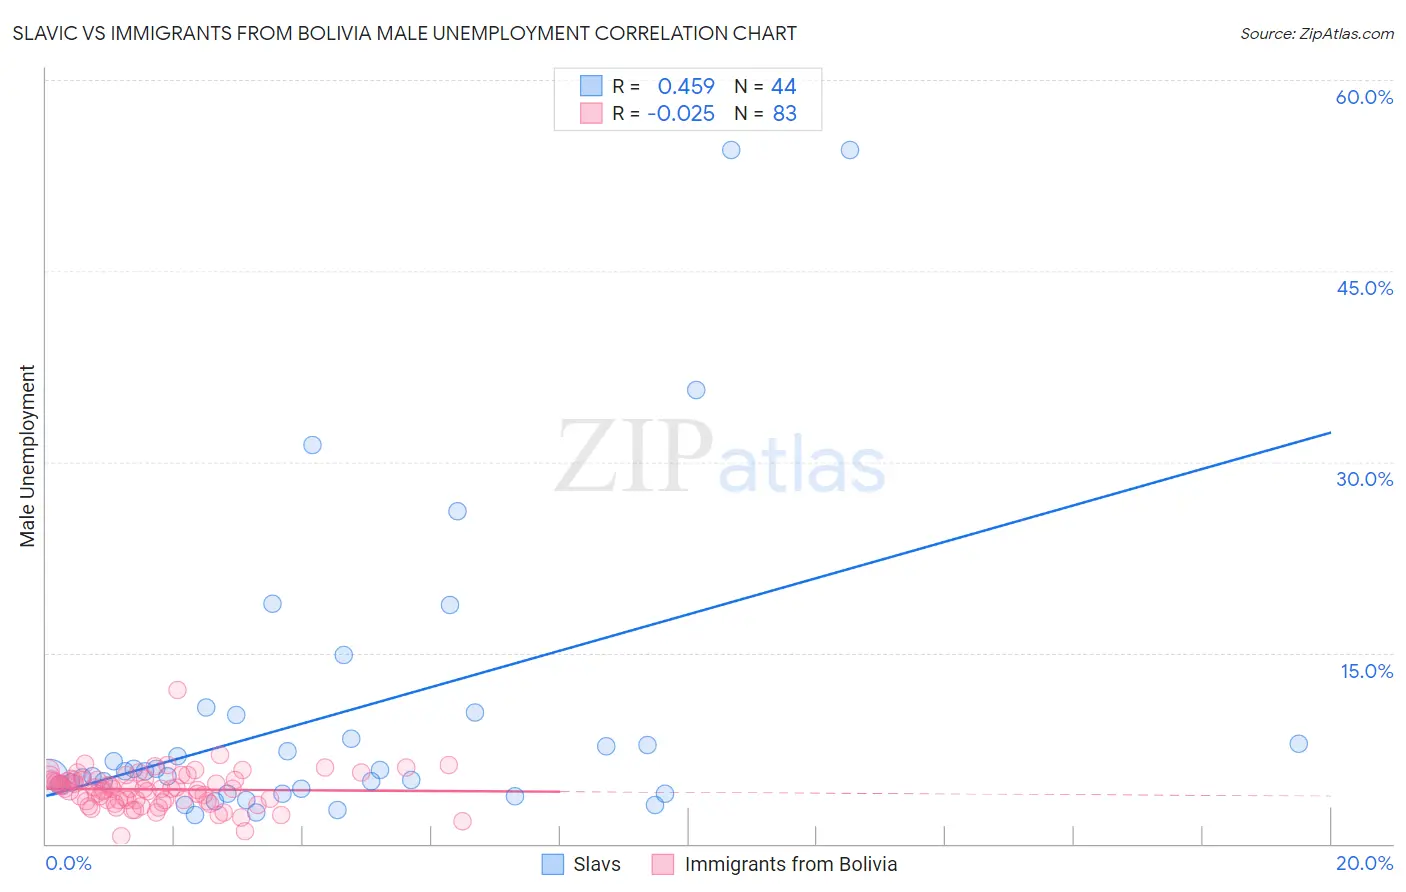
Slavic vs Immigrants from Bolivia Male Unemployment Correlation Chart
The statistical analysis conducted on geographies consisting of 270,129,729 people shows a moderate positive correlation between the proportion of Slavs and unemployment rate among males in the United States with a correlation coefficient (R) of 0.459 and weighted average of 5.1%. Similarly, the statistical analysis conducted on geographies consisting of 158,566,605 people shows no correlation between the proportion of Immigrants from Bolivia and unemployment rate among males in the United States with a correlation coefficient (R) of -0.025 and weighted average of 4.7%, a difference of 9.0%.
Male Unemployment Correlation Summary
| Measurement | Slavic | Immigrants from Bolivia |
| Minimum | 2.2% | 0.60% |
| Maximum | 54.5% | 12.1% |
| Range | 52.3% | 11.5% |
| Mean | 10.3% | 4.3% |
| Median | 5.7% | 4.3% |
| Interquartile 25% (IQ1) | 4.1% | 3.4% |
| Interquartile 75% (IQ3) | 9.1% | 5.0% |
| Interquartile Range (IQR) | 5.0% | 1.7% |
| Standard Deviation (Sample) | 12.2% | 1.5% |
| Standard Deviation (Population) | 12.1% | 1.5% |
Similar Demographics by Male Unemployment
Demographics Similar to Slavs by Male Unemployment
In terms of male unemployment, the demographic groups most similar to Slavs are Immigrants from Serbia (5.1%, a difference of 0.0%), Canadian (5.1%, a difference of 0.050%), Immigrants from Turkey (5.1%, a difference of 0.060%), Italian (5.1%, a difference of 0.12%), and Immigrants from Australia (5.1%, a difference of 0.14%).
| Demographics | Rating | Rank | Male Unemployment |
| Immigrants | North Macedonia | 95.6 /100 | #85 | Exceptional 5.1% |
| Maltese | 95.5 /100 | #86 | Exceptional 5.1% |
| Immigrants | Romania | 95.4 /100 | #87 | Exceptional 5.1% |
| Immigrants | Sri Lanka | 94.9 /100 | #88 | Exceptional 5.1% |
| Immigrants | Australia | 94.7 /100 | #89 | Exceptional 5.1% |
| Okinawans | 94.7 /100 | #90 | Exceptional 5.1% |
| Immigrants | Turkey | 94.4 /100 | #91 | Exceptional 5.1% |
| Slavs | 94.2 /100 | #92 | Exceptional 5.1% |
| Immigrants | Serbia | 94.2 /100 | #93 | Exceptional 5.1% |
| Canadians | 94.1 /100 | #94 | Exceptional 5.1% |
| Italians | 93.8 /100 | #95 | Exceptional 5.1% |
| Asians | 93.7 /100 | #96 | Exceptional 5.1% |
| Immigrants | Spain | 93.4 /100 | #97 | Exceptional 5.1% |
| Immigrants | Kuwait | 93.3 /100 | #98 | Exceptional 5.1% |
| Uruguayans | 93.0 /100 | #99 | Exceptional 5.1% |
Demographics Similar to Immigrants from Bolivia by Male Unemployment
In terms of male unemployment, the demographic groups most similar to Immigrants from Bolivia are Bolivian (4.7%, a difference of 0.68%), German (4.7%, a difference of 0.70%), Swedish (4.6%, a difference of 0.73%), Cuban (4.6%, a difference of 0.93%), and Scandinavian (4.7%, a difference of 0.97%).
| Demographics | Rating | Rank | Male Unemployment |
| Danes | 100.0 /100 | #5 | Exceptional 4.5% |
| Venezuelans | 100.0 /100 | #6 | Exceptional 4.5% |
| Czechs | 100.0 /100 | #7 | Exceptional 4.5% |
| Luxembourgers | 100.0 /100 | #8 | Exceptional 4.5% |
| Thais | 100.0 /100 | #9 | Exceptional 4.6% |
| Cubans | 100.0 /100 | #10 | Exceptional 4.6% |
| Swedes | 100.0 /100 | #11 | Exceptional 4.6% |
| Immigrants | Bolivia | 100.0 /100 | #12 | Exceptional 4.7% |
| Bolivians | 100.0 /100 | #13 | Exceptional 4.7% |
| Germans | 100.0 /100 | #14 | Exceptional 4.7% |
| Scandinavians | 100.0 /100 | #15 | Exceptional 4.7% |
| Swiss | 99.9 /100 | #16 | Exceptional 4.7% |
| Filipinos | 99.9 /100 | #17 | Exceptional 4.7% |
| English | 99.9 /100 | #18 | Exceptional 4.8% |
| Europeans | 99.9 /100 | #19 | Exceptional 4.8% |