African vs Immigrants from Bolivia College, 1 year or more
COMPARE
African
Immigrants from Bolivia
College, 1 year or more
College, 1 year or more Comparison
Africans
Immigrants from Bolivia
55.0%
COLLEGE, 1 YEAR OR MORE
0.4/ 100
METRIC RATING
258th/ 347
METRIC RANK
62.8%
COLLEGE, 1 YEAR OR MORE
98.7/ 100
METRIC RATING
82nd/ 347
METRIC RANK
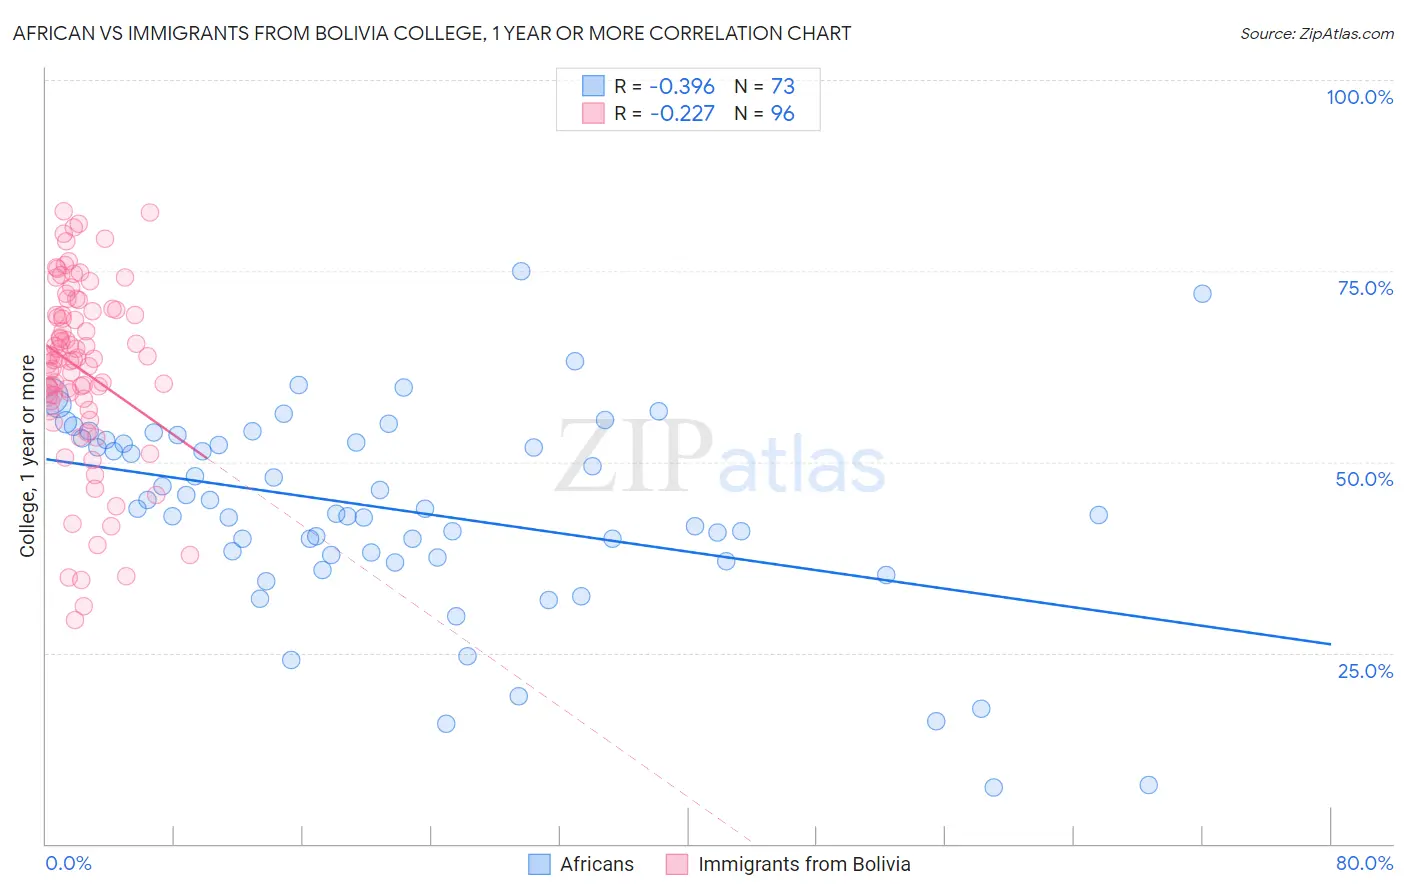
African vs Immigrants from Bolivia College, 1 year or more Correlation Chart
The statistical analysis conducted on geographies consisting of 470,090,594 people shows a mild negative correlation between the proportion of Africans and percentage of population with at least college, 1 year or more education in the United States with a correlation coefficient (R) of -0.396 and weighted average of 55.0%. Similarly, the statistical analysis conducted on geographies consisting of 158,732,804 people shows a weak negative correlation between the proportion of Immigrants from Bolivia and percentage of population with at least college, 1 year or more education in the United States with a correlation coefficient (R) of -0.227 and weighted average of 62.8%, a difference of 14.3%.
College, 1 year or more Correlation Summary
| Measurement | African | Immigrants from Bolivia |
| Minimum | 7.4% | 29.3% |
| Maximum | 75.0% | 82.9% |
| Range | 67.6% | 53.5% |
| Mean | 43.7% | 62.2% |
| Median | 43.8% | 63.5% |
| Interquartile 25% (IQ1) | 37.7% | 58.1% |
| Interquartile 75% (IQ3) | 53.0% | 69.8% |
| Interquartile Range (IQR) | 15.3% | 11.7% |
| Standard Deviation (Sample) | 13.2% | 11.9% |
| Standard Deviation (Population) | 13.1% | 11.8% |
Similar Demographics by College, 1 year or more
Demographics Similar to Africans by College, 1 year or more
In terms of college, 1 year or more, the demographic groups most similar to Africans are Nepalese (54.9%, a difference of 0.060%), Jamaican (54.9%, a difference of 0.16%), Ottawa (54.9%, a difference of 0.19%), Immigrants from St. Vincent and the Grenadines (54.8%, a difference of 0.27%), and Indonesian (55.1%, a difference of 0.28%).
| Demographics | Rating | Rank | College, 1 year or more |
| Immigrants | Cambodia | 0.6 /100 | #251 | Tragic 55.4% |
| Aleuts | 0.6 /100 | #252 | Tragic 55.4% |
| Immigrants | Barbados | 0.6 /100 | #253 | Tragic 55.4% |
| Japanese | 0.5 /100 | #254 | Tragic 55.2% |
| Immigrants | Bahamas | 0.5 /100 | #255 | Tragic 55.2% |
| Immigrants | West Indies | 0.5 /100 | #256 | Tragic 55.2% |
| Indonesians | 0.4 /100 | #257 | Tragic 55.1% |
| Africans | 0.4 /100 | #258 | Tragic 55.0% |
| Nepalese | 0.3 /100 | #259 | Tragic 54.9% |
| Jamaicans | 0.3 /100 | #260 | Tragic 54.9% |
| Ottawa | 0.3 /100 | #261 | Tragic 54.9% |
| Immigrants | St. Vincent and the Grenadines | 0.3 /100 | #262 | Tragic 54.8% |
| U.S. Virgin Islanders | 0.3 /100 | #263 | Tragic 54.8% |
| Immigrants | Micronesia | 0.3 /100 | #264 | Tragic 54.8% |
| Immigrants | Laos | 0.2 /100 | #265 | Tragic 54.7% |
Demographics Similar to Immigrants from Bolivia by College, 1 year or more
In terms of college, 1 year or more, the demographic groups most similar to Immigrants from Bolivia are Immigrants from Argentina (62.8%, a difference of 0.040%), Laotian (62.8%, a difference of 0.050%), Immigrants from England (62.8%, a difference of 0.070%), Immigrants from Pakistan (62.8%, a difference of 0.080%), and Lithuanian (62.9%, a difference of 0.10%).
| Demographics | Rating | Rank | College, 1 year or more |
| Armenians | 98.9 /100 | #75 | Exceptional 63.0% |
| Paraguayans | 98.8 /100 | #76 | Exceptional 62.9% |
| Ethiopians | 98.8 /100 | #77 | Exceptional 62.9% |
| Immigrants | Lebanon | 98.8 /100 | #78 | Exceptional 62.9% |
| Northern Europeans | 98.8 /100 | #79 | Exceptional 62.9% |
| Lithuanians | 98.8 /100 | #80 | Exceptional 62.9% |
| Laotians | 98.7 /100 | #81 | Exceptional 62.8% |
| Immigrants | Bolivia | 98.7 /100 | #82 | Exceptional 62.8% |
| Immigrants | Argentina | 98.6 /100 | #83 | Exceptional 62.8% |
| Immigrants | England | 98.6 /100 | #84 | Exceptional 62.8% |
| Immigrants | Pakistan | 98.6 /100 | #85 | Exceptional 62.8% |
| Immigrants | Western Europe | 98.6 /100 | #86 | Exceptional 62.7% |
| Immigrants | Hungary | 98.6 /100 | #87 | Exceptional 62.7% |
| Greeks | 98.3 /100 | #88 | Exceptional 62.6% |
| Immigrants | Ethiopia | 98.2 /100 | #89 | Exceptional 62.6% |