Cherokee vs Immigrants from Bolivia Male Unemployment
COMPARE
Cherokee
Immigrants from Bolivia
Male Unemployment
Male Unemployment Comparison
Cherokee
Immigrants from Bolivia
5.6%
MALE UNEMPLOYMENT
2.4/ 100
METRIC RATING
224th/ 347
METRIC RANK
4.7%
MALE UNEMPLOYMENT
100.0/ 100
METRIC RATING
12th/ 347
METRIC RANK
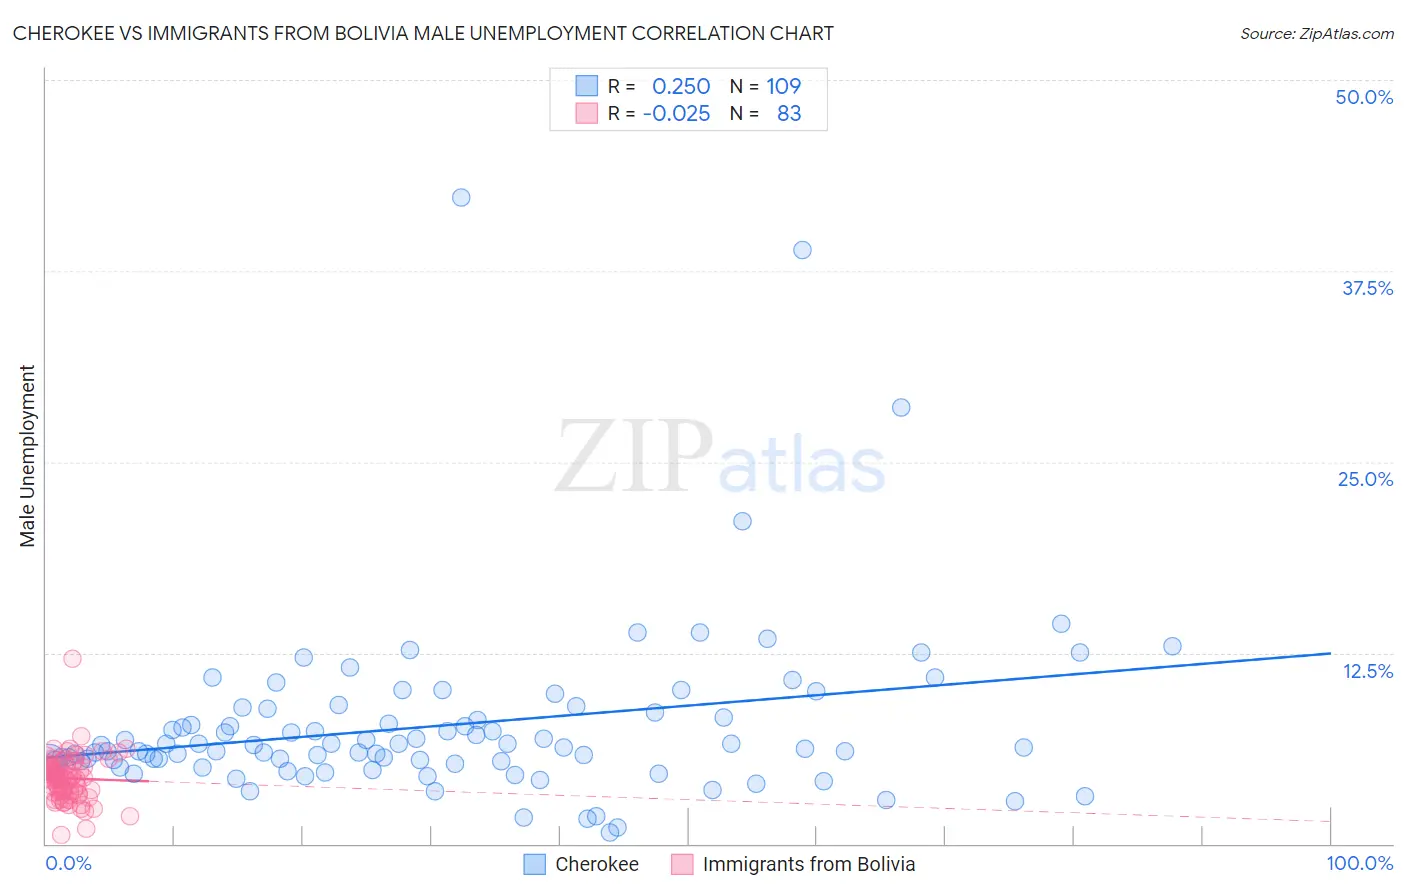
Cherokee vs Immigrants from Bolivia Male Unemployment Correlation Chart
The statistical analysis conducted on geographies consisting of 488,550,213 people shows a weak positive correlation between the proportion of Cherokee and unemployment rate among males in the United States with a correlation coefficient (R) of 0.250 and weighted average of 5.6%. Similarly, the statistical analysis conducted on geographies consisting of 158,566,605 people shows no correlation between the proportion of Immigrants from Bolivia and unemployment rate among males in the United States with a correlation coefficient (R) of -0.025 and weighted average of 4.7%, a difference of 19.8%.
Male Unemployment Correlation Summary
| Measurement | Cherokee | Immigrants from Bolivia |
| Minimum | 0.70% | 0.60% |
| Maximum | 42.3% | 12.1% |
| Range | 41.6% | 11.5% |
| Mean | 7.8% | 4.3% |
| Median | 6.3% | 4.3% |
| Interquartile 25% (IQ1) | 5.3% | 3.4% |
| Interquartile 75% (IQ3) | 8.7% | 5.0% |
| Interquartile Range (IQR) | 3.4% | 1.7% |
| Standard Deviation (Sample) | 5.9% | 1.5% |
| Standard Deviation (Population) | 5.9% | 1.5% |
Similar Demographics by Male Unemployment
Demographics Similar to Cherokee by Male Unemployment
In terms of male unemployment, the demographic groups most similar to Cherokee are Creek (5.6%, a difference of 0.13%), Immigrants from Micronesia (5.6%, a difference of 0.28%), Panamanian (5.6%, a difference of 0.32%), Immigrants from Cambodia (5.6%, a difference of 0.41%), and Immigrants from Panama (5.6%, a difference of 0.41%).
| Demographics | Rating | Rank | Male Unemployment |
| Delaware | 4.2 /100 | #217 | Tragic 5.5% |
| Immigrants | Albania | 3.6 /100 | #218 | Tragic 5.5% |
| Immigrants | Western Asia | 3.5 /100 | #219 | Tragic 5.6% |
| Portuguese | 3.5 /100 | #220 | Tragic 5.6% |
| Soviet Union | 3.2 /100 | #221 | Tragic 5.6% |
| Immigrants | Micronesia | 2.9 /100 | #222 | Tragic 5.6% |
| Creek | 2.6 /100 | #223 | Tragic 5.6% |
| Cherokee | 2.4 /100 | #224 | Tragic 5.6% |
| Panamanians | 1.9 /100 | #225 | Tragic 5.6% |
| Immigrants | Cambodia | 1.8 /100 | #226 | Tragic 5.6% |
| Immigrants | Panama | 1.8 /100 | #227 | Tragic 5.6% |
| Seminole | 1.8 /100 | #228 | Tragic 5.6% |
| Central Americans | 1.8 /100 | #229 | Tragic 5.6% |
| Immigrants | Africa | 1.7 /100 | #230 | Tragic 5.6% |
| Choctaw | 1.6 /100 | #231 | Tragic 5.6% |
Demographics Similar to Immigrants from Bolivia by Male Unemployment
In terms of male unemployment, the demographic groups most similar to Immigrants from Bolivia are Bolivian (4.7%, a difference of 0.68%), German (4.7%, a difference of 0.70%), Swedish (4.6%, a difference of 0.73%), Cuban (4.6%, a difference of 0.93%), and Scandinavian (4.7%, a difference of 0.97%).
| Demographics | Rating | Rank | Male Unemployment |
| Danes | 100.0 /100 | #5 | Exceptional 4.5% |
| Venezuelans | 100.0 /100 | #6 | Exceptional 4.5% |
| Czechs | 100.0 /100 | #7 | Exceptional 4.5% |
| Luxembourgers | 100.0 /100 | #8 | Exceptional 4.5% |
| Thais | 100.0 /100 | #9 | Exceptional 4.6% |
| Cubans | 100.0 /100 | #10 | Exceptional 4.6% |
| Swedes | 100.0 /100 | #11 | Exceptional 4.6% |
| Immigrants | Bolivia | 100.0 /100 | #12 | Exceptional 4.7% |
| Bolivians | 100.0 /100 | #13 | Exceptional 4.7% |
| Germans | 100.0 /100 | #14 | Exceptional 4.7% |
| Scandinavians | 100.0 /100 | #15 | Exceptional 4.7% |
| Swiss | 99.9 /100 | #16 | Exceptional 4.7% |
| Filipinos | 99.9 /100 | #17 | Exceptional 4.7% |
| English | 99.9 /100 | #18 | Exceptional 4.8% |
| Europeans | 99.9 /100 | #19 | Exceptional 4.8% |