Zip Codes with the Highest Percentage of Population Employed in Agriculture, Fishing & Hunting in Texarkana, TX
RELATED REPORTS & OPTIONS
Agriculture, Fishing & Hunting
Texarkana
Compare Zip Codes
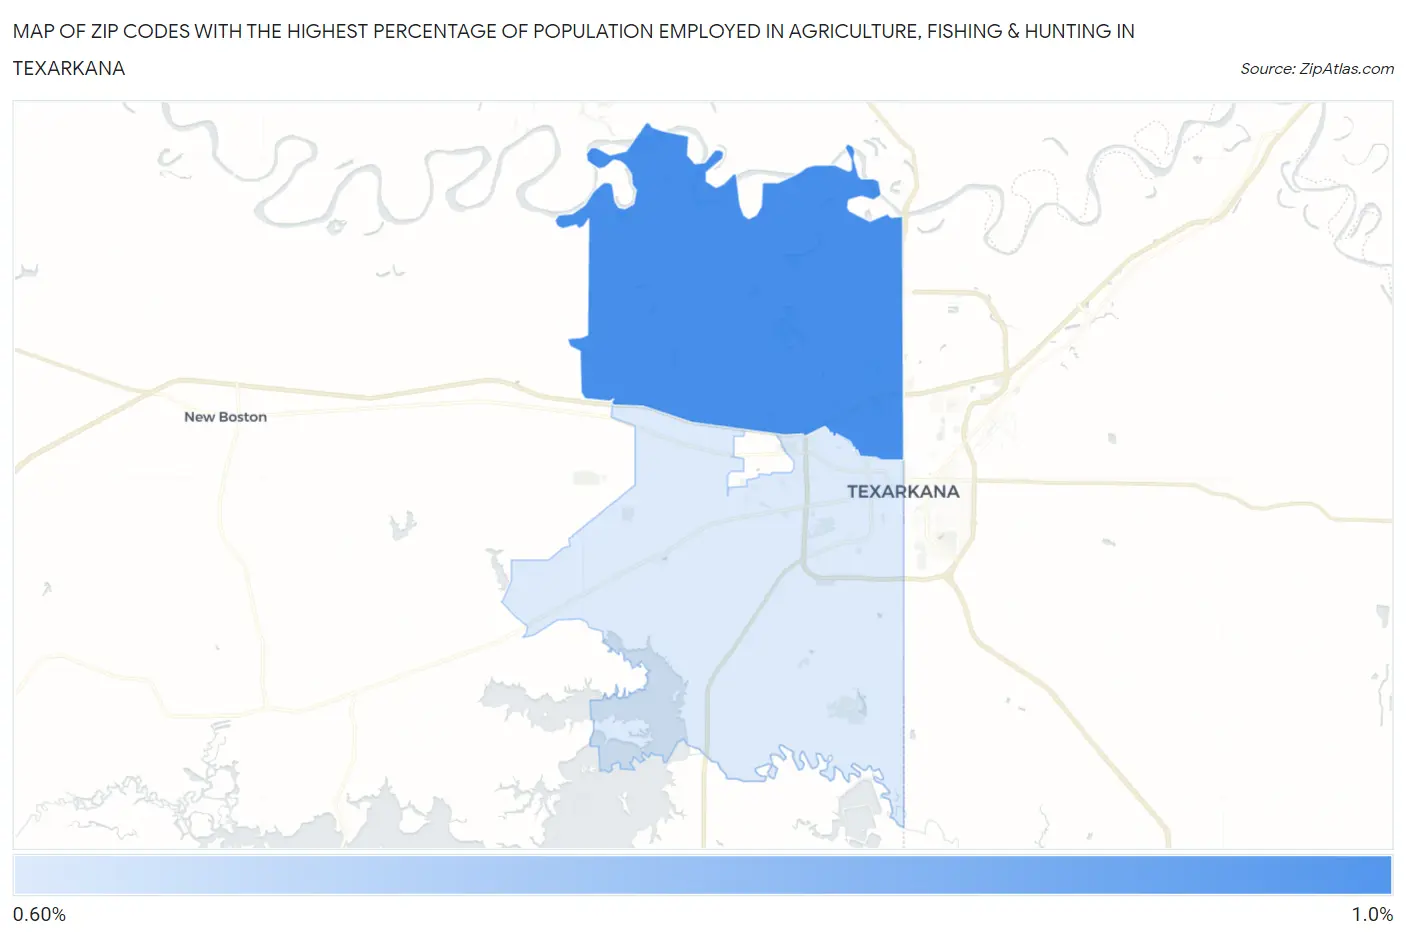
Map of Zip Codes with the Highest Percentage of Population Employed in Agriculture, Fishing & Hunting in Texarkana
0.62%
0.86%
Zip Codes with the Highest Percentage of Population Employed in Agriculture, Fishing & Hunting in Texarkana, TX
| Zip Code | % Employed | vs State | vs National | |
| 1. | 75503 | 0.86% | 0.75%(+0.106)#897 | 1.2%(-0.341)#16,933 |
| 2. | 75501 | 0.62% | 0.75%(-0.130)#982 | 1.2%(-0.578)#18,340 |
1
Common Questions
What are the Top Zip Codes with the Highest Percentage of Population Employed in Agriculture, Fishing & Hunting in Texarkana, TX?
Top Zip Codes with the Highest Percentage of Population Employed in Agriculture, Fishing & Hunting in Texarkana, TX are:
What zip code has the Highest Percentage of Population Employed in Agriculture, Fishing & Hunting in Texarkana, TX?
75503 has the Highest Percentage of Population Employed in Agriculture, Fishing & Hunting in Texarkana, TX with 0.86%.
What is the Percentage of Population Employed in Agriculture, Fishing & Hunting in Texarkana, TX?
Percentage of Population Employed in Agriculture, Fishing & Hunting in Texarkana is 1.1%.
What is the Percentage of Population Employed in Agriculture, Fishing & Hunting in Texas?
Percentage of Population Employed in Agriculture, Fishing & Hunting in Texas is 0.75%.
What is the Percentage of Population Employed in Agriculture, Fishing & Hunting in the United States?
Percentage of Population Employed in Agriculture, Fishing & Hunting in the United States is 1.2%.