Zip Codes with the Highest Percentage of Population Employed in Agriculture, Fishing & Hunting in Rapid City, SD
RELATED REPORTS & OPTIONS
Agriculture, Fishing & Hunting
Rapid City
Compare Zip Codes
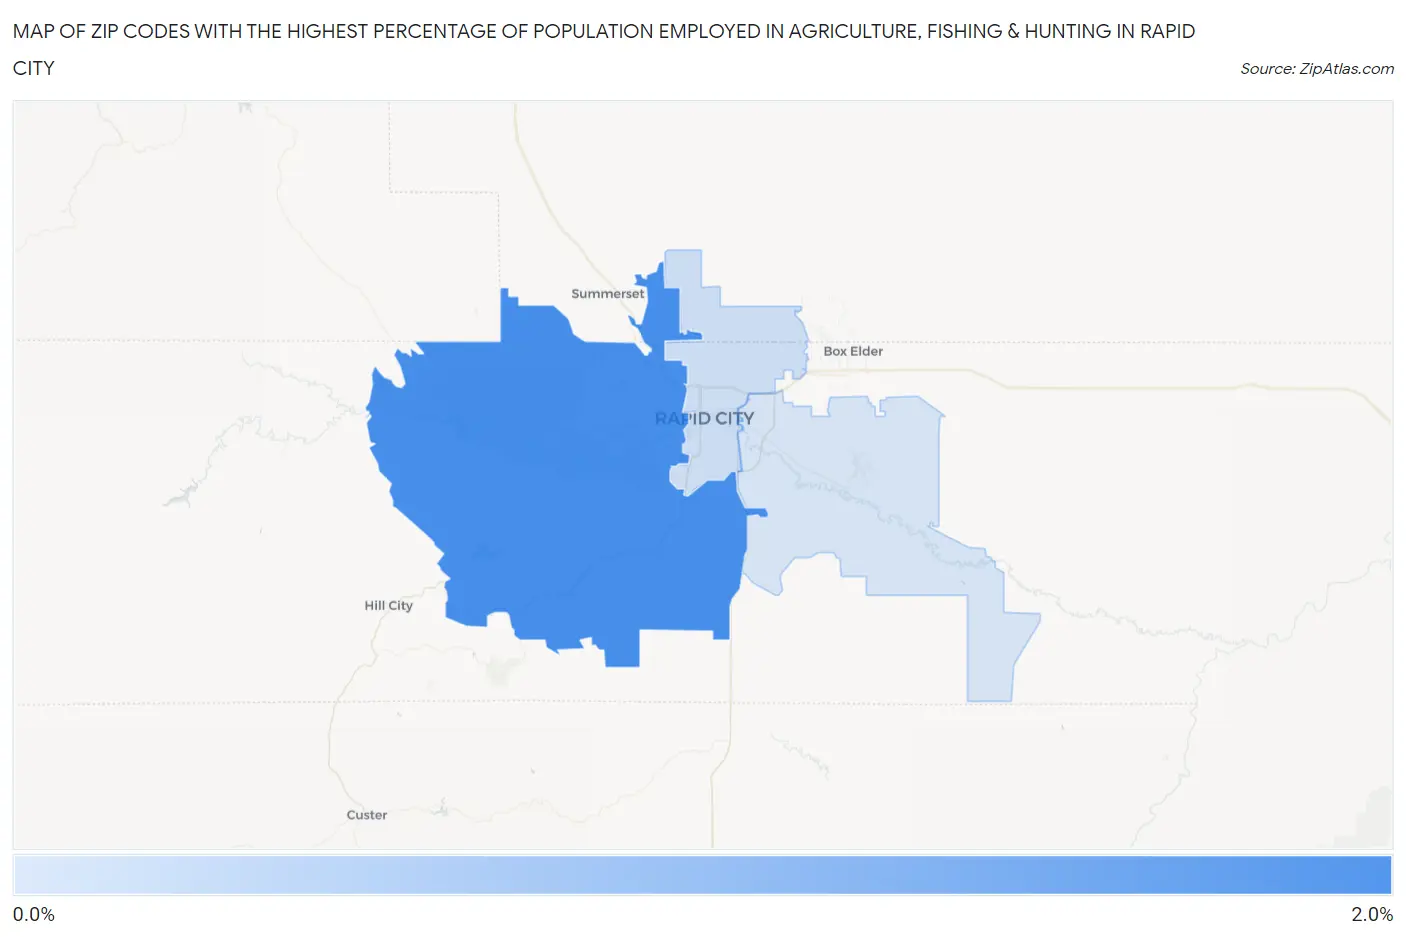
Map of Zip Codes with the Highest Percentage of Population Employed in Agriculture, Fishing & Hunting in Rapid City
0.63%
1.5%
Zip Codes with the Highest Percentage of Population Employed in Agriculture, Fishing & Hunting in Rapid City, SD
| Zip Code | % Employed | vs State | vs National | |
| 1. | 57702 | 1.5% | 5.9%(-4.37)#333 | 1.2%(+0.328)#14,203 |
| 2. | 57701 | 0.70% | 5.9%(-5.19)#343 | 1.2%(-0.501)#17,854 |
| 3. | 57703 | 0.63% | 5.9%(-5.27)#345 | 1.2%(-0.572)#18,294 |
1
Common Questions
What are the Top Zip Codes with the Highest Percentage of Population Employed in Agriculture, Fishing & Hunting in Rapid City, SD?
Top Zip Codes with the Highest Percentage of Population Employed in Agriculture, Fishing & Hunting in Rapid City, SD are:
What zip code has the Highest Percentage of Population Employed in Agriculture, Fishing & Hunting in Rapid City, SD?
57702 has the Highest Percentage of Population Employed in Agriculture, Fishing & Hunting in Rapid City, SD with 1.5%.
What is the Percentage of Population Employed in Agriculture, Fishing & Hunting in Rapid City, SD?
Percentage of Population Employed in Agriculture, Fishing & Hunting in Rapid City is 0.92%.
What is the Percentage of Population Employed in Agriculture, Fishing & Hunting in South Dakota?
Percentage of Population Employed in Agriculture, Fishing & Hunting in South Dakota is 5.9%.
What is the Percentage of Population Employed in Agriculture, Fishing & Hunting in the United States?
Percentage of Population Employed in Agriculture, Fishing & Hunting in the United States is 1.2%.