Zimbabwean vs Shoshone No Schooling Completed
COMPARE
Zimbabwean
Shoshone
No Schooling Completed
No Schooling Completed Comparison
Zimbabweans
Shoshone
1.7%
NO SCHOOLING COMPLETED
99.4/ 100
METRIC RATING
74th/ 347
METRIC RANK
2.0%
NO SCHOOLING COMPLETED
76.7/ 100
METRIC RATING
148th/ 347
METRIC RANK
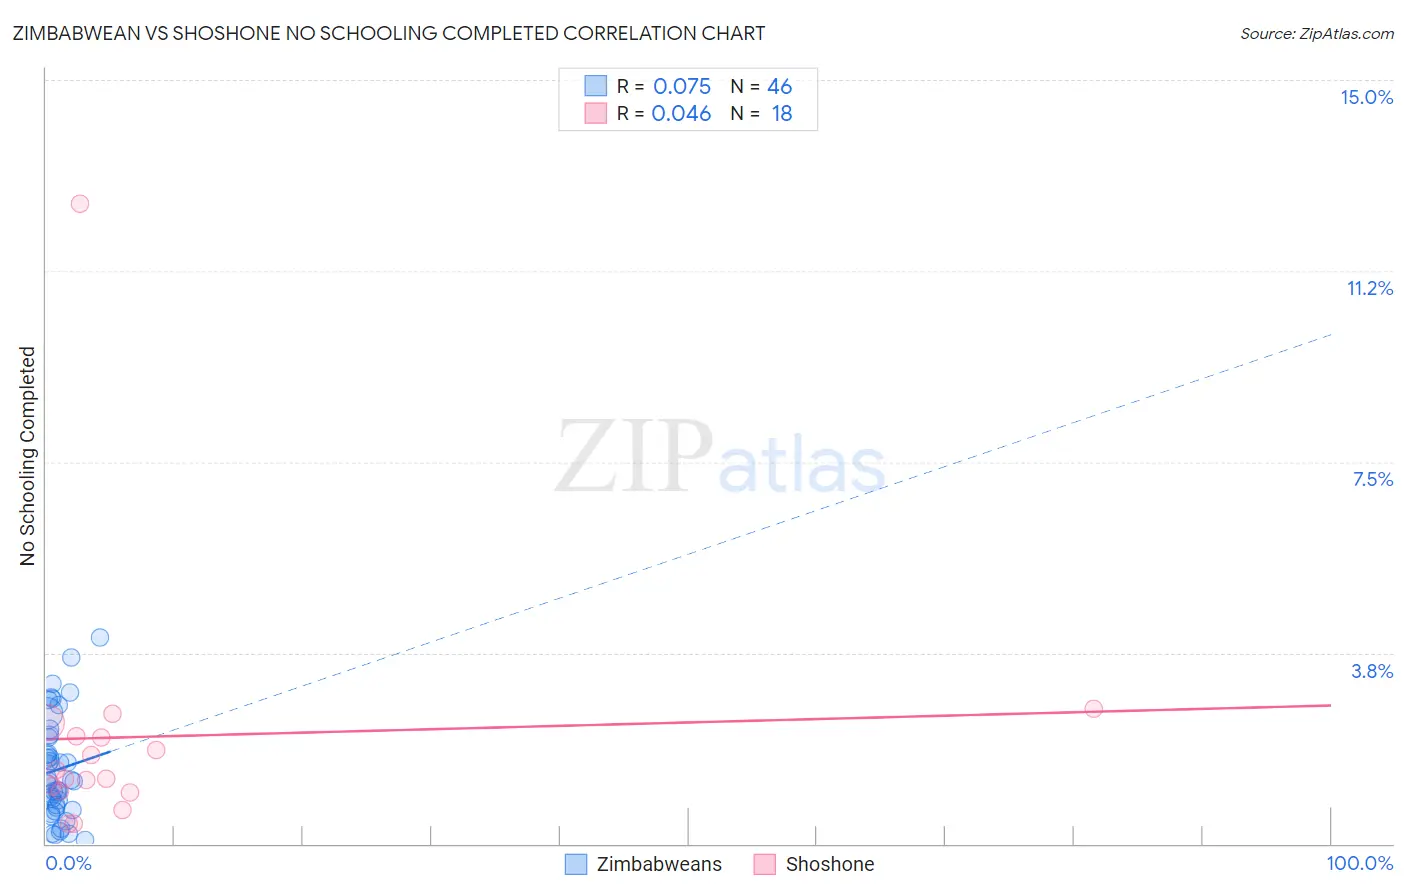
Zimbabwean vs Shoshone No Schooling Completed Correlation Chart
The statistical analysis conducted on geographies consisting of 69,120,863 people shows a slight positive correlation between the proportion of Zimbabweans and percentage of population with no schooling in the United States with a correlation coefficient (R) of 0.075 and weighted average of 1.7%. Similarly, the statistical analysis conducted on geographies consisting of 66,330,496 people shows no correlation between the proportion of Shoshone and percentage of population with no schooling in the United States with a correlation coefficient (R) of 0.046 and weighted average of 2.0%, a difference of 16.2%.
No Schooling Completed Correlation Summary
| Measurement | Zimbabwean | Shoshone |
| Minimum | 0.063% | 0.39% |
| Maximum | 4.1% | 12.6% |
| Range | 4.0% | 12.2% |
| Mean | 1.5% | 2.1% |
| Median | 1.2% | 1.4% |
| Interquartile 25% (IQ1) | 0.71% | 1.0% |
| Interquartile 75% (IQ3) | 2.1% | 2.1% |
| Interquartile Range (IQR) | 1.4% | 1.1% |
| Standard Deviation (Sample) | 0.99% | 2.7% |
| Standard Deviation (Population) | 0.98% | 2.6% |
Similar Demographics by No Schooling Completed
Demographics Similar to Zimbabweans by No Schooling Completed
In terms of no schooling completed, the demographic groups most similar to Zimbabweans are Immigrants from India (1.7%, a difference of 0.020%), Cajun (1.7%, a difference of 0.50%), Immigrants from Belgium (1.7%, a difference of 0.58%), Cherokee (1.7%, a difference of 0.63%), and Immigrants from England (1.7%, a difference of 0.68%).
| Demographics | Rating | Rank | No Schooling Completed |
| Immigrants | Austria | 99.7 /100 | #67 | Exceptional 1.7% |
| Immigrants | Lithuania | 99.7 /100 | #68 | Exceptional 1.7% |
| Chickasaw | 99.6 /100 | #69 | Exceptional 1.7% |
| Immigrants | Netherlands | 99.6 /100 | #70 | Exceptional 1.7% |
| Immigrants | England | 99.5 /100 | #71 | Exceptional 1.7% |
| Cajuns | 99.5 /100 | #72 | Exceptional 1.7% |
| Immigrants | India | 99.4 /100 | #73 | Exceptional 1.7% |
| Zimbabweans | 99.4 /100 | #74 | Exceptional 1.7% |
| Immigrants | Belgium | 99.3 /100 | #75 | Exceptional 1.7% |
| Cherokee | 99.3 /100 | #76 | Exceptional 1.7% |
| Immigrants | Sweden | 99.3 /100 | #77 | Exceptional 1.7% |
| Delaware | 99.3 /100 | #78 | Exceptional 1.7% |
| Macedonians | 99.3 /100 | #79 | Exceptional 1.7% |
| Cypriots | 99.3 /100 | #80 | Exceptional 1.7% |
| Icelanders | 99.3 /100 | #81 | Exceptional 1.7% |
Demographics Similar to Shoshone by No Schooling Completed
In terms of no schooling completed, the demographic groups most similar to Shoshone are Soviet Union (2.0%, a difference of 0.080%), Immigrants from North Macedonia (2.0%, a difference of 0.15%), Immigrants from Moldova (2.0%, a difference of 0.26%), Immigrants from Iran (2.0%, a difference of 0.47%), and Alsatian (2.0%, a difference of 0.48%).
| Demographics | Rating | Rank | No Schooling Completed |
| Immigrants | Greece | 83.5 /100 | #141 | Excellent 2.0% |
| Venezuelans | 81.5 /100 | #142 | Excellent 2.0% |
| Immigrants | South Central Asia | 80.0 /100 | #143 | Good 2.0% |
| Alsatians | 79.1 /100 | #144 | Good 2.0% |
| Immigrants | Iran | 79.0 /100 | #145 | Good 2.0% |
| Immigrants | Moldova | 78.0 /100 | #146 | Good 2.0% |
| Soviet Union | 77.1 /100 | #147 | Good 2.0% |
| Shoshone | 76.7 /100 | #148 | Good 2.0% |
| Immigrants | North Macedonia | 75.9 /100 | #149 | Good 2.0% |
| Blackfeet | 72.9 /100 | #150 | Good 2.0% |
| Immigrants | Jordan | 70.9 /100 | #151 | Good 2.0% |
| Immigrants | Eastern Europe | 70.4 /100 | #152 | Good 2.0% |
| Immigrants | Italy | 68.9 /100 | #153 | Good 2.0% |
| Immigrants | Venezuela | 68.5 /100 | #154 | Good 2.0% |
| Immigrants | Russia | 67.6 /100 | #155 | Good 2.0% |