Zimbabwean vs Pakistani Child Poverty Under the Age of 16
COMPARE
Zimbabwean
Pakistani
Child Poverty Under the Age of 16
Child Poverty Under the Age of 16 Comparison
Zimbabweans
Pakistanis
14.2%
CHILD POVERTY UNDER THE AGE OF 16
98.5/ 100
METRIC RATING
62nd/ 347
METRIC RANK
15.0%
CHILD POVERTY UNDER THE AGE OF 16
91.7/ 100
METRIC RATING
122nd/ 347
METRIC RANK
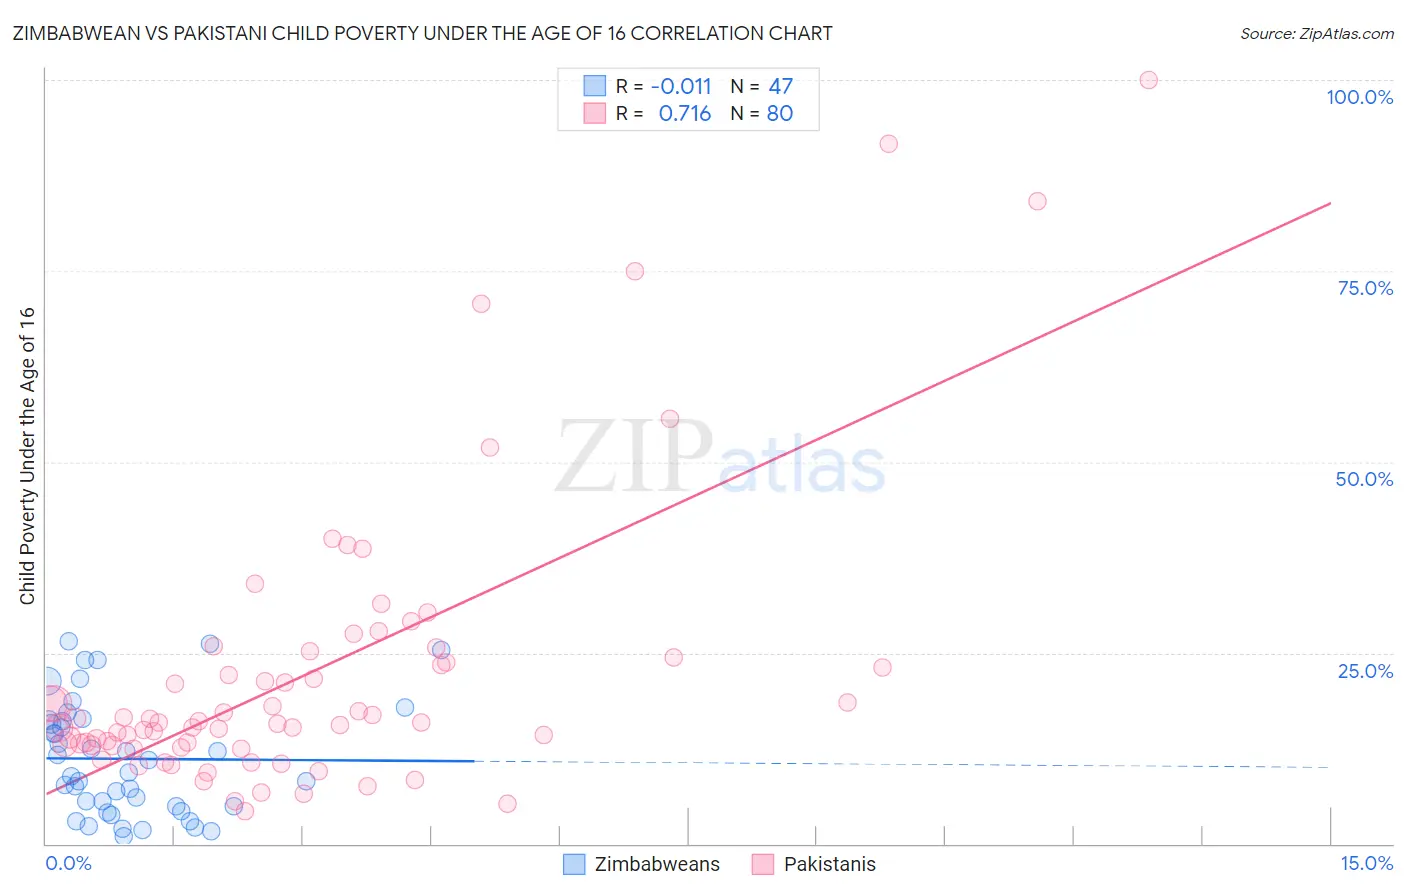
Zimbabwean vs Pakistani Child Poverty Under the Age of 16 Correlation Chart
The statistical analysis conducted on geographies consisting of 69,119,153 people shows no correlation between the proportion of Zimbabweans and poverty level among children under the age of 16 in the United States with a correlation coefficient (R) of -0.011 and weighted average of 14.2%. Similarly, the statistical analysis conducted on geographies consisting of 333,364,420 people shows a strong positive correlation between the proportion of Pakistanis and poverty level among children under the age of 16 in the United States with a correlation coefficient (R) of 0.716 and weighted average of 15.0%, a difference of 6.2%.
Child Poverty Under the Age of 16 Correlation Summary
| Measurement | Zimbabwean | Pakistani |
| Minimum | 1.0% | 4.3% |
| Maximum | 26.5% | 100.0% |
| Range | 25.4% | 95.7% |
| Mean | 11.1% | 22.3% |
| Median | 9.4% | 15.8% |
| Interquartile 25% (IQ1) | 4.9% | 12.9% |
| Interquartile 75% (IQ3) | 16.2% | 24.0% |
| Interquartile Range (IQR) | 11.3% | 11.1% |
| Standard Deviation (Sample) | 7.4% | 18.9% |
| Standard Deviation (Population) | 7.4% | 18.8% |
Similar Demographics by Child Poverty Under the Age of 16
Demographics Similar to Zimbabweans by Child Poverty Under the Age of 16
In terms of child poverty under the age of 16, the demographic groups most similar to Zimbabweans are Immigrants from Sweden (14.2%, a difference of 0.010%), Immigrants from Austria (14.2%, a difference of 0.050%), Scandinavian (14.1%, a difference of 0.23%), Immigrants from Pakistan (14.1%, a difference of 0.25%), and Immigrants from Belgium (14.1%, a difference of 0.27%).
| Demographics | Rating | Rank | Child Poverty Under the Age of 16 |
| Immigrants | Indonesia | 98.7 /100 | #55 | Exceptional 14.1% |
| Immigrants | Serbia | 98.7 /100 | #56 | Exceptional 14.1% |
| Immigrants | Belgium | 98.6 /100 | #57 | Exceptional 14.1% |
| Immigrants | Pakistan | 98.6 /100 | #58 | Exceptional 14.1% |
| Scandinavians | 98.6 /100 | #59 | Exceptional 14.1% |
| Immigrants | Austria | 98.5 /100 | #60 | Exceptional 14.2% |
| Immigrants | Sweden | 98.5 /100 | #61 | Exceptional 14.2% |
| Zimbabweans | 98.5 /100 | #62 | Exceptional 14.2% |
| Immigrants | Europe | 98.4 /100 | #63 | Exceptional 14.2% |
| Immigrants | Romania | 98.3 /100 | #64 | Exceptional 14.2% |
| Immigrants | Philippines | 98.2 /100 | #65 | Exceptional 14.3% |
| Slovenes | 98.1 /100 | #66 | Exceptional 14.3% |
| Europeans | 98.1 /100 | #67 | Exceptional 14.3% |
| Laotians | 98.0 /100 | #68 | Exceptional 14.3% |
| Immigrants | Bulgaria | 98.0 /100 | #69 | Exceptional 14.3% |
Demographics Similar to Pakistanis by Child Poverty Under the Age of 16
In terms of child poverty under the age of 16, the demographic groups most similar to Pakistanis are South African (15.0%, a difference of 0.20%), Immigrants from Zimbabwe (15.0%, a difference of 0.20%), Immigrants from Brazil (15.1%, a difference of 0.24%), Czechoslovakian (15.1%, a difference of 0.25%), and Scottish (15.0%, a difference of 0.29%).
| Demographics | Rating | Rank | Child Poverty Under the Age of 16 |
| Immigrants | Ukraine | 93.1 /100 | #115 | Exceptional 14.9% |
| Carpatho Rusyns | 93.1 /100 | #116 | Exceptional 14.9% |
| Immigrants | Norway | 92.8 /100 | #117 | Exceptional 15.0% |
| Immigrants | Malaysia | 92.6 /100 | #118 | Exceptional 15.0% |
| Scottish | 92.3 /100 | #119 | Exceptional 15.0% |
| South Africans | 92.1 /100 | #120 | Exceptional 15.0% |
| Immigrants | Zimbabwe | 92.1 /100 | #121 | Exceptional 15.0% |
| Pakistanis | 91.7 /100 | #122 | Exceptional 15.0% |
| Immigrants | Brazil | 91.1 /100 | #123 | Exceptional 15.1% |
| Czechoslovakians | 91.0 /100 | #124 | Exceptional 15.1% |
| Palestinians | 90.9 /100 | #125 | Exceptional 15.1% |
| Portuguese | 90.6 /100 | #126 | Exceptional 15.1% |
| Immigrants | Western Europe | 90.3 /100 | #127 | Exceptional 15.1% |
| Immigrants | Kazakhstan | 90.2 /100 | #128 | Exceptional 15.1% |
| Immigrants | Southern Europe | 89.7 /100 | #129 | Excellent 15.1% |