Yuman vs Vietnamese High School Diploma
COMPARE
Yuman
Vietnamese
High School Diploma
High School Diploma Comparison
Yuman
Vietnamese
84.0%
HIGH SCHOOL DIPLOMA
0.0/ 100
METRIC RATING
321st/ 347
METRIC RANK
85.4%
HIGH SCHOOL DIPLOMA
0.0/ 100
METRIC RATING
301st/ 347
METRIC RANK
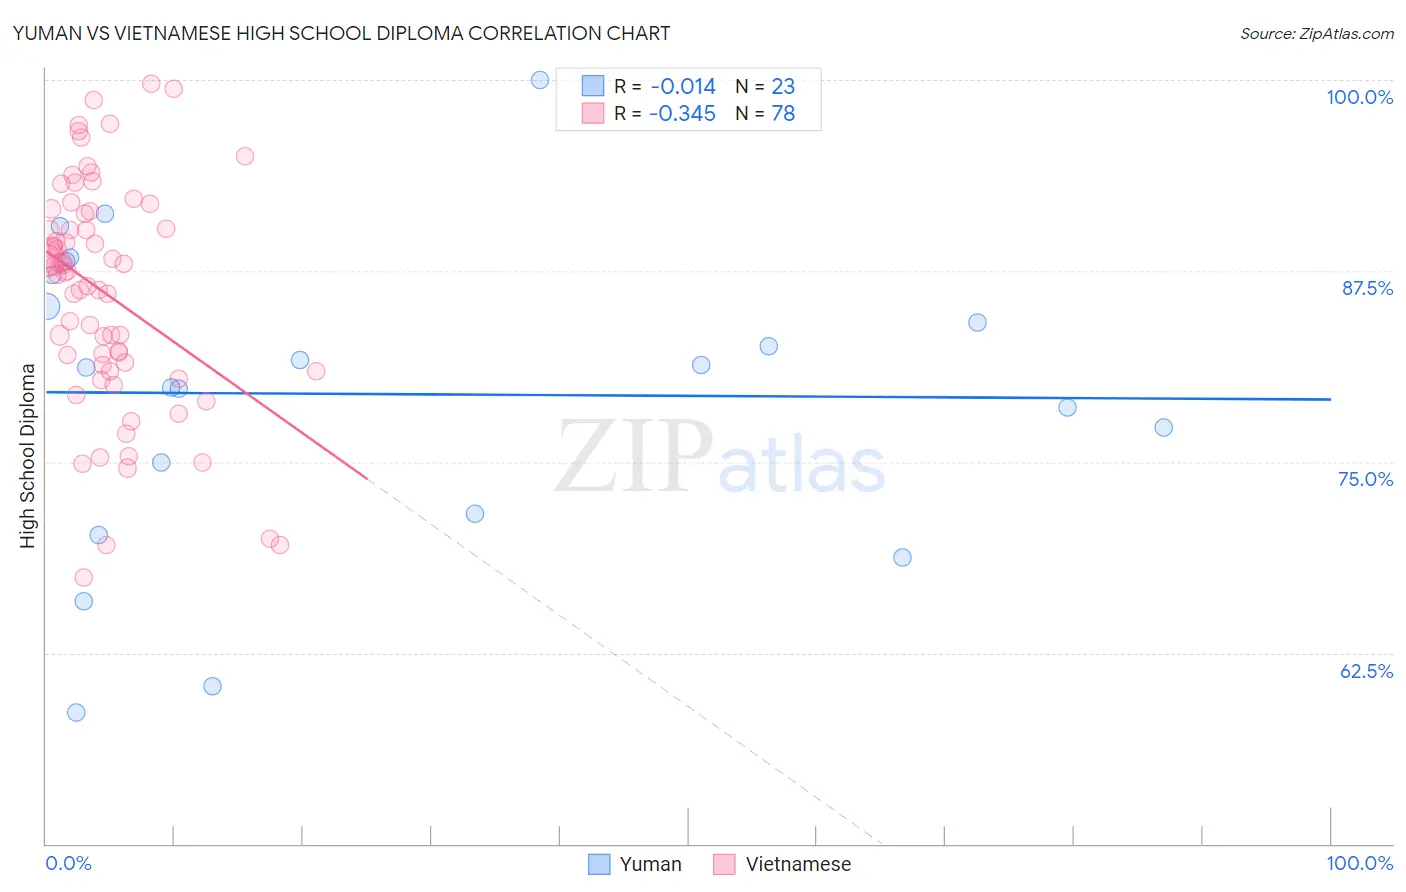
Yuman vs Vietnamese High School Diploma Correlation Chart
The statistical analysis conducted on geographies consisting of 40,696,349 people shows no correlation between the proportion of Yuman and percentage of population with at least high school diploma education in the United States with a correlation coefficient (R) of -0.014 and weighted average of 84.0%. Similarly, the statistical analysis conducted on geographies consisting of 170,753,564 people shows a mild negative correlation between the proportion of Vietnamese and percentage of population with at least high school diploma education in the United States with a correlation coefficient (R) of -0.345 and weighted average of 85.4%, a difference of 1.7%.
High School Diploma Correlation Summary
| Measurement | Yuman | Vietnamese |
| Minimum | 58.6% | 67.5% |
| Maximum | 100.0% | 99.8% |
| Range | 41.4% | 32.3% |
| Mean | 79.4% | 86.1% |
| Median | 81.2% | 87.6% |
| Interquartile 25% (IQ1) | 71.6% | 81.3% |
| Interquartile 75% (IQ3) | 87.2% | 91.3% |
| Interquartile Range (IQR) | 15.6% | 9.9% |
| Standard Deviation (Sample) | 10.1% | 7.3% |
| Standard Deviation (Population) | 9.9% | 7.3% |
Demographics Similar to Yuman and Vietnamese by High School Diploma
In terms of high school diploma, the demographic groups most similar to Yuman are Nicaraguan (84.1%, a difference of 0.14%), Central American Indian (84.2%, a difference of 0.24%), Immigrants from Belize (84.2%, a difference of 0.27%), Immigrants from Caribbean (84.3%, a difference of 0.34%), and Belizean (84.3%, a difference of 0.40%). Similarly, the demographic groups most similar to Vietnamese are Immigrants from Haiti (85.4%, a difference of 0.040%), Cuban (85.4%, a difference of 0.040%), Nepalese (85.3%, a difference of 0.15%), Immigrants from Portugal (85.3%, a difference of 0.15%), and Immigrants from Guyana (85.3%, a difference of 0.20%).
| Demographics | Rating | Rank | High School Diploma |
| Vietnamese | 0.0 /100 | #301 | Tragic 85.4% |
| Immigrants | Haiti | 0.0 /100 | #302 | Tragic 85.4% |
| Cubans | 0.0 /100 | #303 | Tragic 85.4% |
| Nepalese | 0.0 /100 | #304 | Tragic 85.3% |
| Immigrants | Portugal | 0.0 /100 | #305 | Tragic 85.3% |
| Immigrants | Guyana | 0.0 /100 | #306 | Tragic 85.3% |
| Navajo | 0.0 /100 | #307 | Tragic 85.2% |
| Immigrants | Armenia | 0.0 /100 | #308 | Tragic 85.2% |
| Immigrants | Dominica | 0.0 /100 | #309 | Tragic 85.2% |
| Apache | 0.0 /100 | #310 | Tragic 85.1% |
| Ecuadorians | 0.0 /100 | #311 | Tragic 85.1% |
| Cape Verdeans | 0.0 /100 | #312 | Tragic 85.1% |
| Immigrants | Ecuador | 0.0 /100 | #313 | Tragic 84.8% |
| Yaqui | 0.0 /100 | #314 | Tragic 84.7% |
| Puerto Ricans | 0.0 /100 | #315 | Tragic 84.7% |
| Belizeans | 0.0 /100 | #316 | Tragic 84.3% |
| Immigrants | Caribbean | 0.0 /100 | #317 | Tragic 84.3% |
| Immigrants | Belize | 0.0 /100 | #318 | Tragic 84.2% |
| Central American Indians | 0.0 /100 | #319 | Tragic 84.2% |
| Nicaraguans | 0.0 /100 | #320 | Tragic 84.1% |
| Yuman | 0.0 /100 | #321 | Tragic 84.0% |