Immigrants from Syria vs Vietnamese Male Poverty
COMPARE
Immigrants from Syria
Vietnamese
Male Poverty
Male Poverty Comparison
Immigrants from Syria
Vietnamese
11.3%
MALE POVERTY
40.3/ 100
METRIC RATING
179th/ 347
METRIC RANK
13.8%
MALE POVERTY
0.0/ 100
METRIC RATING
291st/ 347
METRIC RANK
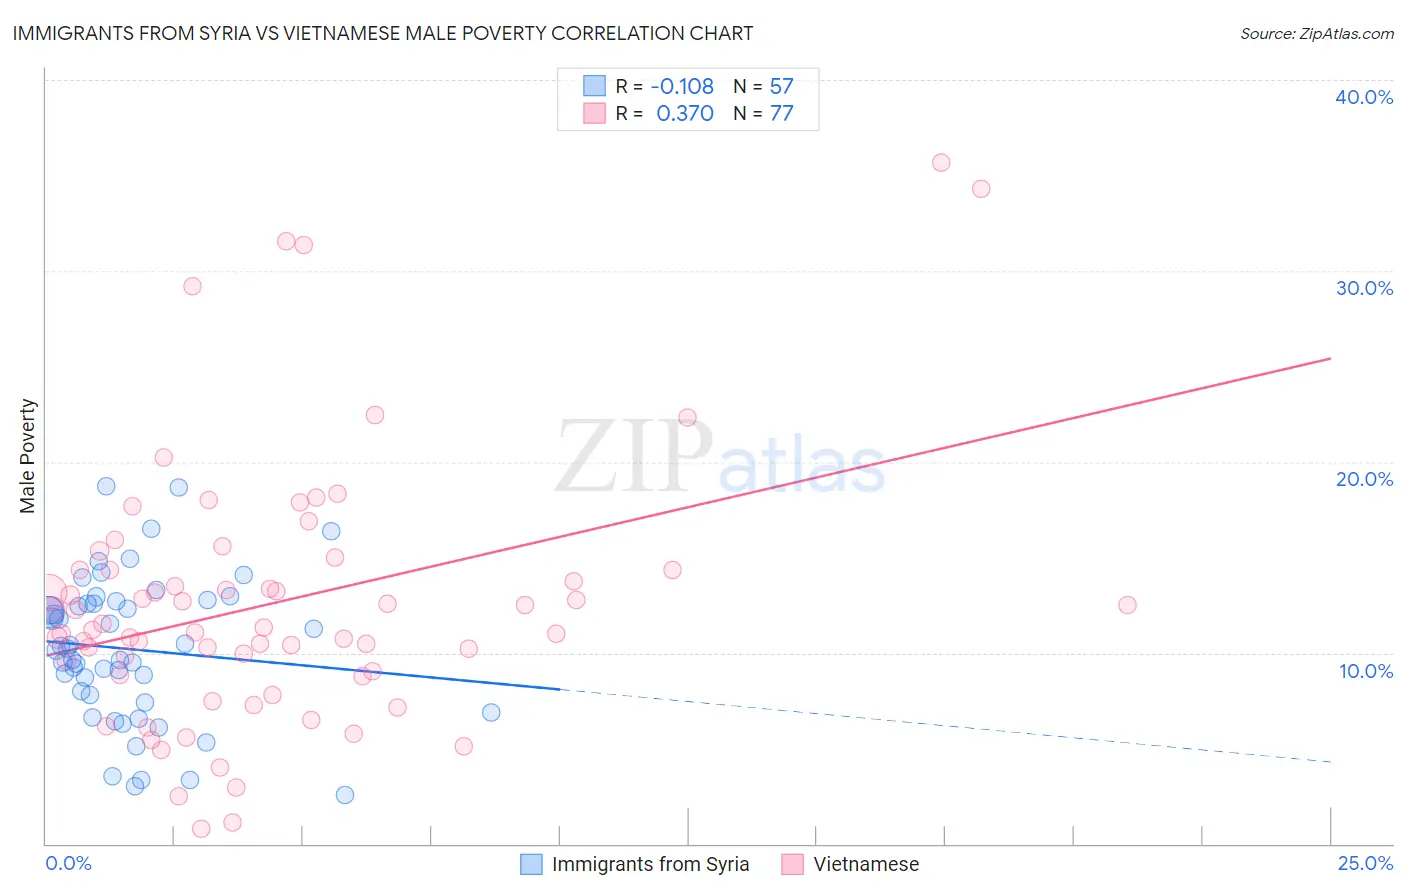
Immigrants from Syria vs Vietnamese Male Poverty Correlation Chart
The statistical analysis conducted on geographies consisting of 173,977,512 people shows a poor negative correlation between the proportion of Immigrants from Syria and poverty level among males in the United States with a correlation coefficient (R) of -0.108 and weighted average of 11.3%. Similarly, the statistical analysis conducted on geographies consisting of 170,649,781 people shows a mild positive correlation between the proportion of Vietnamese and poverty level among males in the United States with a correlation coefficient (R) of 0.370 and weighted average of 13.8%, a difference of 22.4%.
Male Poverty Correlation Summary
| Measurement | Immigrants from Syria | Vietnamese |
| Minimum | 2.5% | 0.78% |
| Maximum | 18.7% | 35.7% |
| Range | 16.2% | 34.9% |
| Mean | 10.2% | 12.6% |
| Median | 10.2% | 11.4% |
| Interquartile 25% (IQ1) | 7.6% | 8.9% |
| Interquartile 75% (IQ3) | 12.6% | 14.3% |
| Interquartile Range (IQR) | 5.0% | 5.4% |
| Standard Deviation (Sample) | 3.8% | 6.9% |
| Standard Deviation (Population) | 3.7% | 6.8% |
Similar Demographics by Male Poverty
Demographics Similar to Immigrants from Syria by Male Poverty
In terms of male poverty, the demographic groups most similar to Immigrants from Syria are Immigrants from Morocco (11.3%, a difference of 0.010%), Immigrants from Costa Rica (11.3%, a difference of 0.080%), Mongolian (11.3%, a difference of 0.13%), Kenyan (11.3%, a difference of 0.19%), and Immigrants from South America (11.3%, a difference of 0.34%).
| Demographics | Rating | Rank | Male Poverty |
| Immigrants | Ethiopia | 50.7 /100 | #172 | Average 11.2% |
| Pennsylvania Germans | 50.5 /100 | #173 | Average 11.2% |
| Immigrants | Oceania | 50.0 /100 | #174 | Average 11.2% |
| Celtics | 47.5 /100 | #175 | Average 11.2% |
| Immigrants | Fiji | 46.0 /100 | #176 | Average 11.2% |
| Lebanese | 45.6 /100 | #177 | Average 11.2% |
| Immigrants | Cameroon | 44.5 /100 | #178 | Average 11.2% |
| Immigrants | Syria | 40.3 /100 | #179 | Average 11.3% |
| Immigrants | Morocco | 40.1 /100 | #180 | Average 11.3% |
| Immigrants | Costa Rica | 39.5 /100 | #181 | Fair 11.3% |
| Mongolians | 39.0 /100 | #182 | Fair 11.3% |
| Kenyans | 38.4 /100 | #183 | Fair 11.3% |
| Immigrants | South America | 36.9 /100 | #184 | Fair 11.3% |
| Immigrants | Afghanistan | 33.3 /100 | #185 | Fair 11.4% |
| Immigrants | Sierra Leone | 32.9 /100 | #186 | Fair 11.4% |
Demographics Similar to Vietnamese by Male Poverty
In terms of male poverty, the demographic groups most similar to Vietnamese are Immigrants from Zaire (13.8%, a difference of 0.090%), Guatemalan (13.8%, a difference of 0.10%), Indonesian (13.8%, a difference of 0.17%), Immigrants from Belize (13.8%, a difference of 0.18%), and Hispanic or Latino (13.9%, a difference of 0.24%).
| Demographics | Rating | Rank | Male Poverty |
| Immigrants | Haiti | 0.0 /100 | #284 | Tragic 13.8% |
| West Indians | 0.0 /100 | #285 | Tragic 13.8% |
| Shoshone | 0.0 /100 | #286 | Tragic 13.8% |
| Immigrants | Barbados | 0.0 /100 | #287 | Tragic 13.8% |
| Immigrants | St. Vincent and the Grenadines | 0.0 /100 | #288 | Tragic 13.8% |
| Guatemalans | 0.0 /100 | #289 | Tragic 13.8% |
| Immigrants | Zaire | 0.0 /100 | #290 | Tragic 13.8% |
| Vietnamese | 0.0 /100 | #291 | Tragic 13.8% |
| Indonesians | 0.0 /100 | #292 | Tragic 13.8% |
| Immigrants | Belize | 0.0 /100 | #293 | Tragic 13.8% |
| Hispanics or Latinos | 0.0 /100 | #294 | Tragic 13.9% |
| Immigrants | Central America | 0.0 /100 | #295 | Tragic 13.9% |
| Cajuns | 0.0 /100 | #296 | Tragic 13.9% |
| Inupiat | 0.0 /100 | #297 | Tragic 14.0% |
| Blackfeet | 0.0 /100 | #298 | Tragic 14.0% |