Yuman vs Vietnamese Unemployment Among Ages 45 to 54 years
COMPARE
Yuman
Vietnamese
Unemployment Among Ages 45 to 54 years
Unemployment Among Ages 45 to 54 years Comparison
Yuman
Vietnamese
9.5%
UNEMPLOYMENT AMONG AGES 45 TO 54 YEARS
0.0/ 100
METRIC RATING
344th/ 347
METRIC RANK
5.4%
UNEMPLOYMENT AMONG AGES 45 TO 54 YEARS
0.0/ 100
METRIC RATING
307th/ 347
METRIC RANK
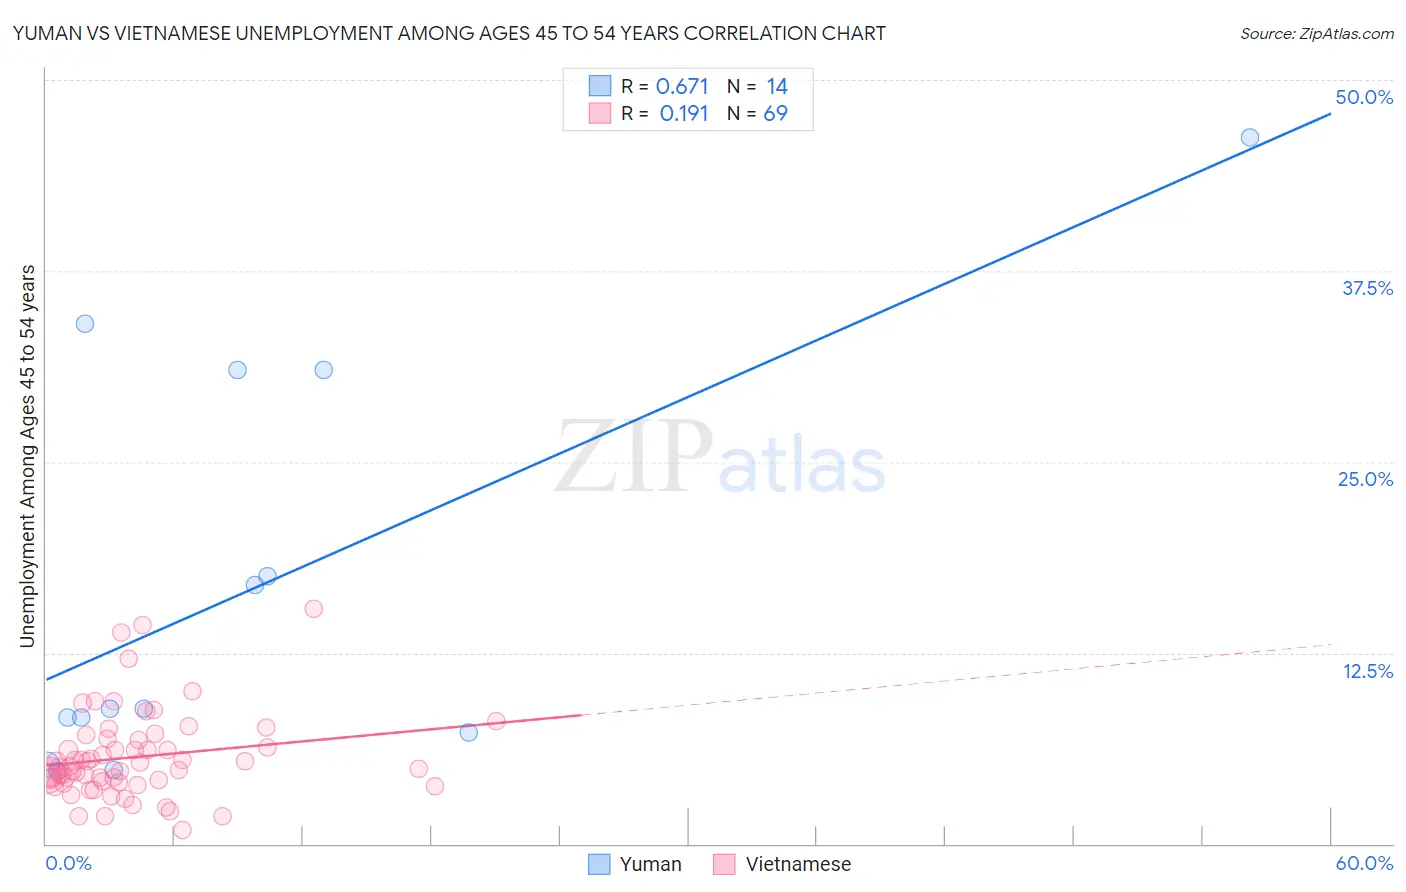
Yuman vs Vietnamese Unemployment Among Ages 45 to 54 years Correlation Chart
The statistical analysis conducted on geographies consisting of 40,470,848 people shows a significant positive correlation between the proportion of Yuman and unemployment rate among population between the ages 45 and 54 in the United States with a correlation coefficient (R) of 0.671 and weighted average of 9.5%. Similarly, the statistical analysis conducted on geographies consisting of 169,266,645 people shows a poor positive correlation between the proportion of Vietnamese and unemployment rate among population between the ages 45 and 54 in the United States with a correlation coefficient (R) of 0.191 and weighted average of 5.4%, a difference of 76.3%.
Unemployment Among Ages 45 to 54 years Correlation Summary
| Measurement | Yuman | Vietnamese |
| Minimum | 4.8% | 0.90% |
| Maximum | 46.2% | 15.4% |
| Range | 41.4% | 14.5% |
| Mean | 16.6% | 5.7% |
| Median | 8.8% | 5.0% |
| Interquartile 25% (IQ1) | 7.3% | 4.1% |
| Interquartile 75% (IQ3) | 31.0% | 6.8% |
| Interquartile Range (IQR) | 23.7% | 2.8% |
| Standard Deviation (Sample) | 13.4% | 2.8% |
| Standard Deviation (Population) | 13.0% | 2.8% |
Similar Demographics by Unemployment Among Ages 45 to 54 years
Demographics Similar to Yuman by Unemployment Among Ages 45 to 54 years
In terms of unemployment among ages 45 to 54 years, the demographic groups most similar to Yuman are Inupiat (9.2%, a difference of 3.3%), Cheyenne (10.6%, a difference of 11.3%), Alaskan Athabascan (8.5%, a difference of 12.2%), Paiute (7.8%, a difference of 22.0%), and Yup'ik (11.9%, a difference of 25.2%).
| Demographics | Rating | Rank | Unemployment Among Ages 45 to 54 years |
| Immigrants | Yemen | 0.0 /100 | #333 | Tragic 6.5% |
| Sioux | 0.0 /100 | #334 | Tragic 6.6% |
| Navajo | 0.0 /100 | #335 | Tragic 6.7% |
| Puerto Ricans | 0.0 /100 | #336 | Tragic 6.8% |
| Apache | 0.0 /100 | #337 | Tragic 7.0% |
| Colville | 0.0 /100 | #338 | Tragic 7.4% |
| Arapaho | 0.0 /100 | #339 | Tragic 7.5% |
| Hopi | 0.0 /100 | #340 | Tragic 7.5% |
| Paiute | 0.0 /100 | #341 | Tragic 7.8% |
| Alaskan Athabascans | 0.0 /100 | #342 | Tragic 8.5% |
| Inupiat | 0.0 /100 | #343 | Tragic 9.2% |
| Yuman | 0.0 /100 | #344 | Tragic 9.5% |
| Cheyenne | 0.0 /100 | #345 | Tragic 10.6% |
| Yup'ik | 0.0 /100 | #346 | Tragic 11.9% |
| Crow | 0.0 /100 | #347 | Tragic 13.7% |
Demographics Similar to Vietnamese by Unemployment Among Ages 45 to 54 years
In terms of unemployment among ages 45 to 54 years, the demographic groups most similar to Vietnamese are Immigrants from Bangladesh (5.4%, a difference of 0.26%), Immigrants from West Indies (5.4%, a difference of 0.42%), Immigrants from Jamaica (5.4%, a difference of 0.59%), Black/African American (5.4%, a difference of 0.76%), and Immigrants from Belize (5.3%, a difference of 0.77%).
| Demographics | Rating | Rank | Unemployment Among Ages 45 to 54 years |
| Central American Indians | 0.0 /100 | #300 | Tragic 5.3% |
| Menominee | 0.0 /100 | #301 | Tragic 5.3% |
| Immigrants | Ecuador | 0.0 /100 | #302 | Tragic 5.3% |
| Immigrants | Belize | 0.0 /100 | #303 | Tragic 5.3% |
| Immigrants | Jamaica | 0.0 /100 | #304 | Tragic 5.4% |
| Immigrants | West Indies | 0.0 /100 | #305 | Tragic 5.4% |
| Immigrants | Bangladesh | 0.0 /100 | #306 | Tragic 5.4% |
| Vietnamese | 0.0 /100 | #307 | Tragic 5.4% |
| Blacks/African Americans | 0.0 /100 | #308 | Tragic 5.4% |
| Barbadians | 0.0 /100 | #309 | Tragic 5.5% |
| Immigrants | Barbados | 0.0 /100 | #310 | Tragic 5.5% |
| Chippewa | 0.0 /100 | #311 | Tragic 5.5% |
| Immigrants | Grenada | 0.0 /100 | #312 | Tragic 5.6% |
| Shoshone | 0.0 /100 | #313 | Tragic 5.6% |
| Guyanese | 0.0 /100 | #314 | Tragic 5.6% |