Yuman vs Immigrants from Grenada Poverty
COMPARE
Yuman
Immigrants from Grenada
Poverty
Poverty Comparison
Yuman
Immigrants from Grenada
20.2%
POVERTY
0.0/ 100
METRIC RATING
338th/ 347
METRIC RANK
15.8%
POVERTY
0.0/ 100
METRIC RATING
313th/ 347
METRIC RANK
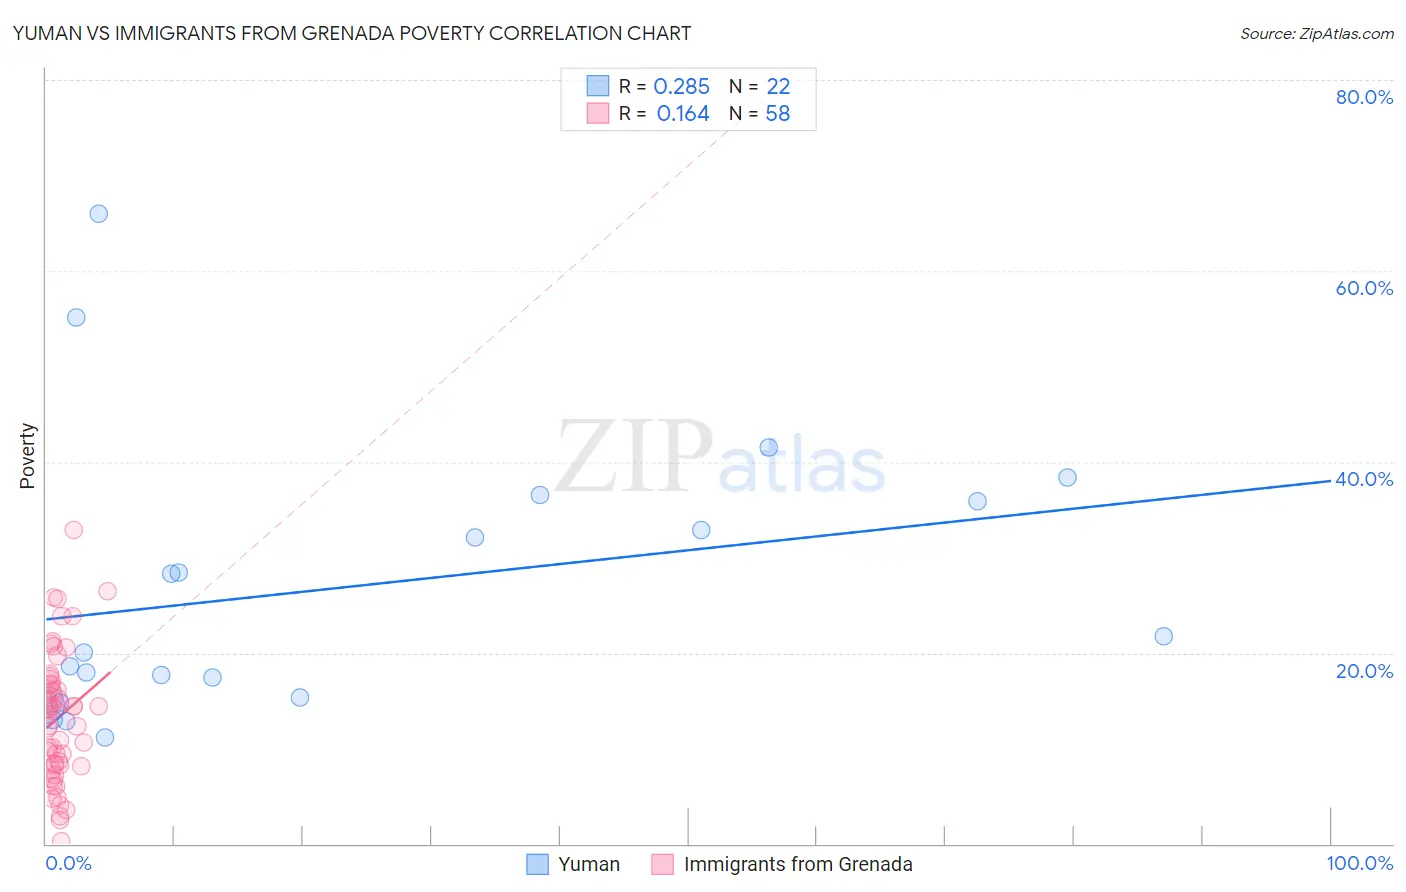
Yuman vs Immigrants from Grenada Poverty Correlation Chart
The statistical analysis conducted on geographies consisting of 40,667,603 people shows a weak positive correlation between the proportion of Yuman and poverty level in the United States with a correlation coefficient (R) of 0.285 and weighted average of 20.2%. Similarly, the statistical analysis conducted on geographies consisting of 67,200,374 people shows a poor positive correlation between the proportion of Immigrants from Grenada and poverty level in the United States with a correlation coefficient (R) of 0.164 and weighted average of 15.8%, a difference of 28.1%.
Poverty Correlation Summary
| Measurement | Yuman | Immigrants from Grenada |
| Minimum | 11.1% | 0.33% |
| Maximum | 66.0% | 32.9% |
| Range | 54.9% | 32.6% |
| Mean | 26.8% | 13.2% |
| Median | 20.9% | 13.8% |
| Interquartile 25% (IQ1) | 15.3% | 8.2% |
| Interquartile 75% (IQ3) | 35.8% | 16.8% |
| Interquartile Range (IQR) | 20.5% | 8.6% |
| Standard Deviation (Sample) | 14.4% | 6.8% |
| Standard Deviation (Population) | 14.1% | 6.8% |
Similar Demographics by Poverty
Demographics Similar to Yuman by Poverty
In terms of poverty, the demographic groups most similar to Yuman are Sioux (19.8%, a difference of 2.2%), Crow (20.7%, a difference of 2.2%), Yup'ik (20.8%, a difference of 3.0%), Hopi (20.8%, a difference of 3.2%), and Pueblo (19.4%, a difference of 4.1%).
| Demographics | Rating | Rank | Poverty |
| Immigrants | Dominican Republic | 0.0 /100 | #331 | Tragic 17.8% |
| Natives/Alaskans | 0.0 /100 | #332 | Tragic 18.1% |
| Houma | 0.0 /100 | #333 | Tragic 18.4% |
| Apache | 0.0 /100 | #334 | Tragic 18.4% |
| Cheyenne | 0.0 /100 | #335 | Tragic 18.9% |
| Pueblo | 0.0 /100 | #336 | Tragic 19.4% |
| Sioux | 0.0 /100 | #337 | Tragic 19.8% |
| Yuman | 0.0 /100 | #338 | Tragic 20.2% |
| Crow | 0.0 /100 | #339 | Tragic 20.7% |
| Yup'ik | 0.0 /100 | #340 | Tragic 20.8% |
| Hopi | 0.0 /100 | #341 | Tragic 20.8% |
| Immigrants | Yemen | 0.0 /100 | #342 | Tragic 21.5% |
| Pima | 0.0 /100 | #343 | Tragic 21.9% |
| Lumbee | 0.0 /100 | #344 | Tragic 21.9% |
| Navajo | 0.0 /100 | #345 | Tragic 23.1% |
Demographics Similar to Immigrants from Grenada by Poverty
In terms of poverty, the demographic groups most similar to Immigrants from Grenada are Immigrants from Somalia (15.8%, a difference of 0.12%), Cajun (15.7%, a difference of 0.44%), British West Indian (15.9%, a difference of 0.49%), Honduran (15.9%, a difference of 0.49%), and Chippewa (15.7%, a difference of 0.60%).
| Demographics | Rating | Rank | Poverty |
| Creek | 0.0 /100 | #306 | Tragic 15.6% |
| Africans | 0.0 /100 | #307 | Tragic 15.6% |
| Choctaw | 0.0 /100 | #308 | Tragic 15.6% |
| Seminole | 0.0 /100 | #309 | Tragic 15.6% |
| Dutch West Indians | 0.0 /100 | #310 | Tragic 15.6% |
| Chippewa | 0.0 /100 | #311 | Tragic 15.7% |
| Cajuns | 0.0 /100 | #312 | Tragic 15.7% |
| Immigrants | Grenada | 0.0 /100 | #313 | Tragic 15.8% |
| Immigrants | Somalia | 0.0 /100 | #314 | Tragic 15.8% |
| British West Indians | 0.0 /100 | #315 | Tragic 15.9% |
| Hondurans | 0.0 /100 | #316 | Tragic 15.9% |
| U.S. Virgin Islanders | 0.0 /100 | #317 | Tragic 16.1% |
| Immigrants | Dominica | 0.0 /100 | #318 | Tragic 16.1% |
| Immigrants | Congo | 0.0 /100 | #319 | Tragic 16.1% |
| Immigrants | Honduras | 0.0 /100 | #320 | Tragic 16.2% |