Guyanese vs Immigrants from Grenada Poverty
COMPARE
Guyanese
Immigrants from Grenada
Poverty
Poverty Comparison
Guyanese
Immigrants from Grenada
14.5%
POVERTY
0.1/ 100
METRIC RATING
266th/ 347
METRIC RANK
15.8%
POVERTY
0.0/ 100
METRIC RATING
313th/ 347
METRIC RANK
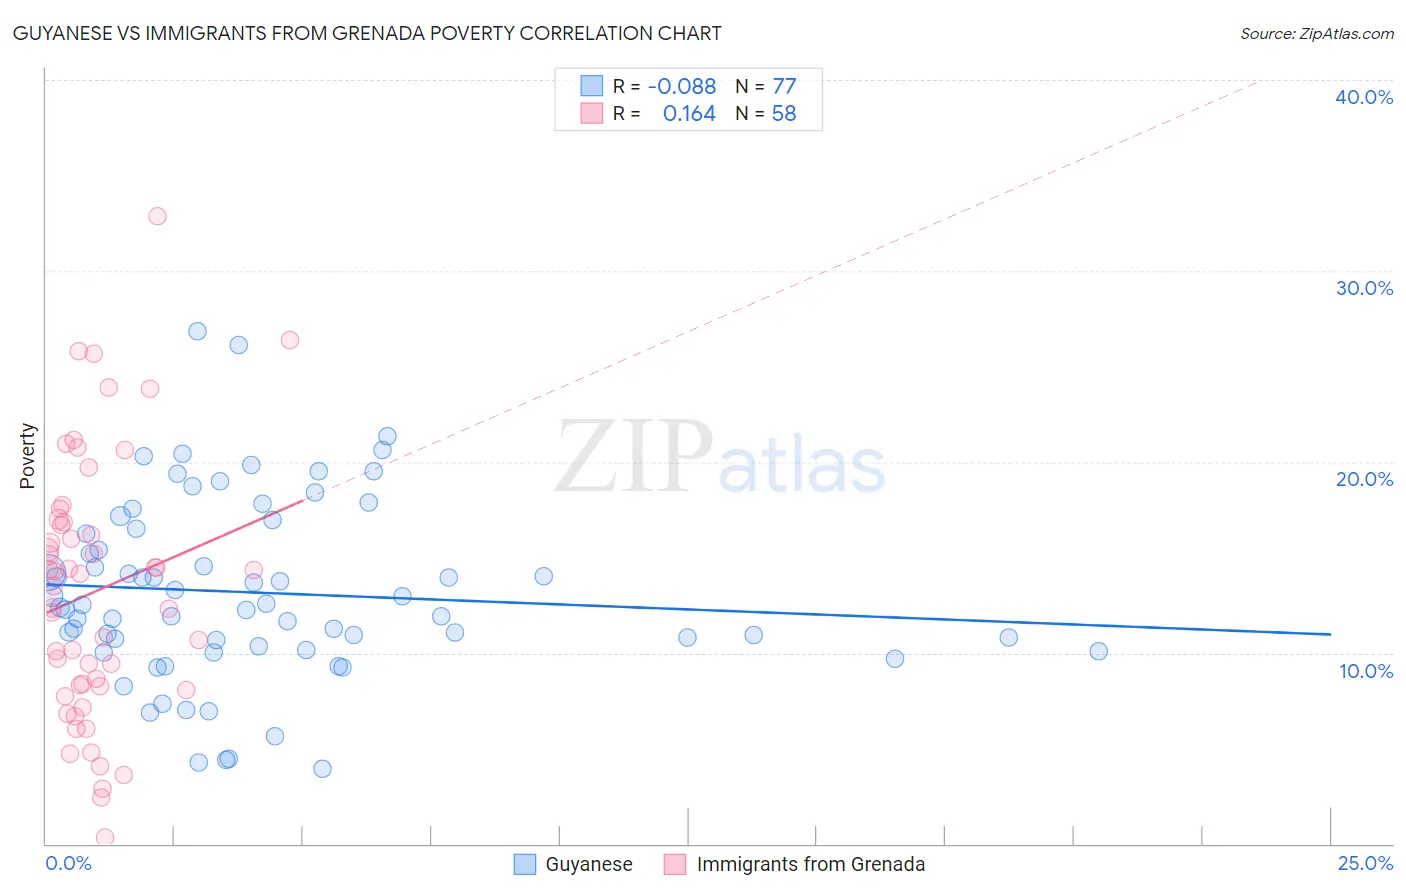
Guyanese vs Immigrants from Grenada Poverty Correlation Chart
The statistical analysis conducted on geographies consisting of 176,811,902 people shows a slight negative correlation between the proportion of Guyanese and poverty level in the United States with a correlation coefficient (R) of -0.088 and weighted average of 14.5%. Similarly, the statistical analysis conducted on geographies consisting of 67,200,374 people shows a poor positive correlation between the proportion of Immigrants from Grenada and poverty level in the United States with a correlation coefficient (R) of 0.164 and weighted average of 15.8%, a difference of 8.9%.
Poverty Correlation Summary
| Measurement | Guyanese | Immigrants from Grenada |
| Minimum | 3.9% | 0.33% |
| Maximum | 26.8% | 32.9% |
| Range | 22.9% | 32.6% |
| Mean | 13.1% | 13.2% |
| Median | 12.4% | 13.8% |
| Interquartile 25% (IQ1) | 10.2% | 8.2% |
| Interquartile 75% (IQ3) | 16.4% | 16.8% |
| Interquartile Range (IQR) | 6.2% | 8.6% |
| Standard Deviation (Sample) | 4.7% | 6.8% |
| Standard Deviation (Population) | 4.7% | 6.8% |
Similar Demographics by Poverty
Demographics Similar to Guyanese by Poverty
In terms of poverty, the demographic groups most similar to Guyanese are Immigrants from Guyana (14.5%, a difference of 0.17%), Immigrants from Jamaica (14.4%, a difference of 0.30%), Iroquois (14.5%, a difference of 0.32%), Subsaharan African (14.5%, a difference of 0.35%), and Jamaican (14.4%, a difference of 0.38%).
| Demographics | Rating | Rank | Poverty |
| Immigrants | Nicaragua | 0.1 /100 | #259 | Tragic 14.3% |
| Cape Verdeans | 0.1 /100 | #260 | Tragic 14.4% |
| Cherokee | 0.1 /100 | #261 | Tragic 14.4% |
| Immigrants | Liberia | 0.1 /100 | #262 | Tragic 14.4% |
| Jamaicans | 0.1 /100 | #263 | Tragic 14.4% |
| Immigrants | Jamaica | 0.1 /100 | #264 | Tragic 14.4% |
| Immigrants | Guyana | 0.1 /100 | #265 | Tragic 14.5% |
| Guyanese | 0.1 /100 | #266 | Tragic 14.5% |
| Iroquois | 0.1 /100 | #267 | Tragic 14.5% |
| Sub-Saharan Africans | 0.1 /100 | #268 | Tragic 14.5% |
| Immigrants | Cuba | 0.1 /100 | #269 | Tragic 14.6% |
| Central Americans | 0.1 /100 | #270 | Tragic 14.6% |
| Shoshone | 0.0 /100 | #271 | Tragic 14.7% |
| Chickasaw | 0.0 /100 | #272 | Tragic 14.7% |
| Spanish Americans | 0.0 /100 | #273 | Tragic 14.7% |
Demographics Similar to Immigrants from Grenada by Poverty
In terms of poverty, the demographic groups most similar to Immigrants from Grenada are Immigrants from Somalia (15.8%, a difference of 0.12%), Cajun (15.7%, a difference of 0.44%), British West Indian (15.9%, a difference of 0.49%), Honduran (15.9%, a difference of 0.49%), and Chippewa (15.7%, a difference of 0.60%).
| Demographics | Rating | Rank | Poverty |
| Creek | 0.0 /100 | #306 | Tragic 15.6% |
| Africans | 0.0 /100 | #307 | Tragic 15.6% |
| Choctaw | 0.0 /100 | #308 | Tragic 15.6% |
| Seminole | 0.0 /100 | #309 | Tragic 15.6% |
| Dutch West Indians | 0.0 /100 | #310 | Tragic 15.6% |
| Chippewa | 0.0 /100 | #311 | Tragic 15.7% |
| Cajuns | 0.0 /100 | #312 | Tragic 15.7% |
| Immigrants | Grenada | 0.0 /100 | #313 | Tragic 15.8% |
| Immigrants | Somalia | 0.0 /100 | #314 | Tragic 15.8% |
| British West Indians | 0.0 /100 | #315 | Tragic 15.9% |
| Hondurans | 0.0 /100 | #316 | Tragic 15.9% |
| U.S. Virgin Islanders | 0.0 /100 | #317 | Tragic 16.1% |
| Immigrants | Dominica | 0.0 /100 | #318 | Tragic 16.1% |
| Immigrants | Congo | 0.0 /100 | #319 | Tragic 16.1% |
| Immigrants | Honduras | 0.0 /100 | #320 | Tragic 16.2% |