Yuman vs Scottish Female Poverty Among 25-34 Year Olds
COMPARE
Yuman
Scottish
Female Poverty Among 25-34 Year Olds
Female Poverty Among 25-34 Year Olds Comparison
Yuman
Scottish
22.9%
FEMALE POVERTY AMONG 25-34 YEAR OLDS
0.0/ 100
METRIC RATING
339th/ 347
METRIC RANK
13.9%
FEMALE POVERTY AMONG 25-34 YEAR OLDS
23.6/ 100
METRIC RATING
196th/ 347
METRIC RANK
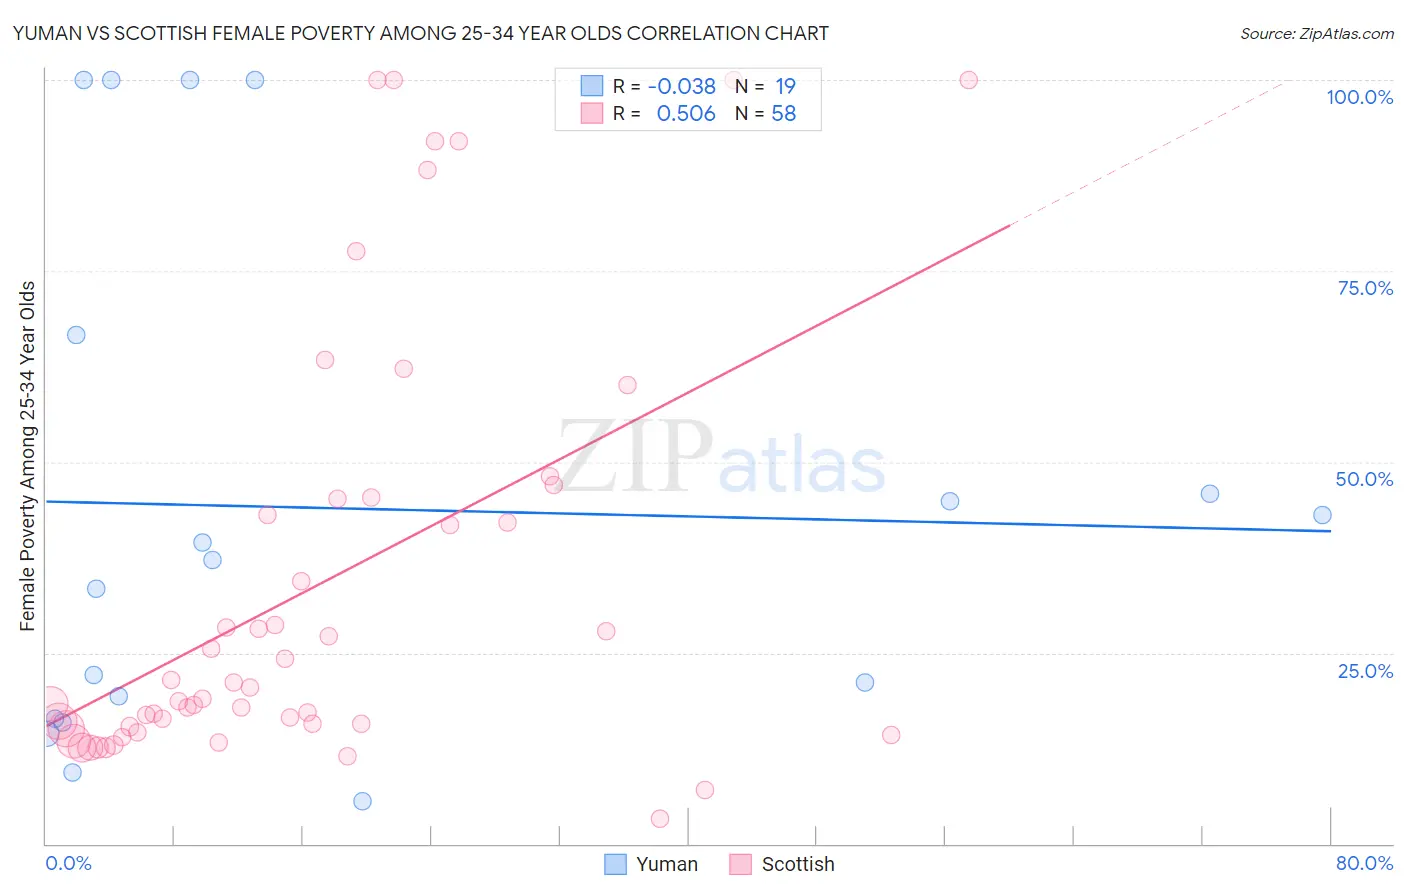
Yuman vs Scottish Female Poverty Among 25-34 Year Olds Correlation Chart
The statistical analysis conducted on geographies consisting of 40,634,660 people shows no correlation between the proportion of Yuman and poverty level among females between the ages 25 and 34 in the United States with a correlation coefficient (R) of -0.038 and weighted average of 22.9%. Similarly, the statistical analysis conducted on geographies consisting of 544,896,820 people shows a substantial positive correlation between the proportion of Scottish and poverty level among females between the ages 25 and 34 in the United States with a correlation coefficient (R) of 0.506 and weighted average of 13.9%, a difference of 65.3%.
Female Poverty Among 25-34 Year Olds Correlation Summary
| Measurement | Yuman | Scottish |
| Minimum | 5.6% | 3.2% |
| Maximum | 100.0% | 100.0% |
| Range | 94.4% | 96.8% |
| Mean | 43.9% | 33.8% |
| Median | 37.2% | 19.7% |
| Interquartile 25% (IQ1) | 16.4% | 15.4% |
| Interquartile 75% (IQ3) | 66.7% | 45.2% |
| Interquartile Range (IQR) | 50.3% | 29.9% |
| Standard Deviation (Sample) | 33.3% | 27.8% |
| Standard Deviation (Population) | 32.4% | 27.6% |
Similar Demographics by Female Poverty Among 25-34 Year Olds
Demographics Similar to Yuman by Female Poverty Among 25-34 Year Olds
In terms of female poverty among 25-34 year olds, the demographic groups most similar to Yuman are Sioux (23.0%, a difference of 0.18%), Houma (22.7%, a difference of 0.85%), Crow (22.7%, a difference of 1.0%), Navajo (23.3%, a difference of 1.9%), and Hopi (23.7%, a difference of 3.3%).
| Demographics | Rating | Rank | Female Poverty Among 25-34 Year Olds |
| Immigrants | Yemen | 0.0 /100 | #332 | Tragic 19.8% |
| Cajuns | 0.0 /100 | #333 | Tragic 19.9% |
| Apache | 0.0 /100 | #334 | Tragic 20.1% |
| Natives/Alaskans | 0.0 /100 | #335 | Tragic 20.3% |
| Pueblo | 0.0 /100 | #336 | Tragic 22.2% |
| Crow | 0.0 /100 | #337 | Tragic 22.7% |
| Houma | 0.0 /100 | #338 | Tragic 22.7% |
| Yuman | 0.0 /100 | #339 | Tragic 22.9% |
| Sioux | 0.0 /100 | #340 | Tragic 23.0% |
| Navajo | 0.0 /100 | #341 | Tragic 23.3% |
| Hopi | 0.0 /100 | #342 | Tragic 23.7% |
| Yup'ik | 0.0 /100 | #343 | Tragic 24.3% |
| Tohono O'odham | 0.0 /100 | #344 | Tragic 24.7% |
| Pima | 0.0 /100 | #345 | Tragic 25.3% |
| Lumbee | 0.0 /100 | #346 | Tragic 26.3% |
Demographics Similar to Scottish by Female Poverty Among 25-34 Year Olds
In terms of female poverty among 25-34 year olds, the demographic groups most similar to Scottish are Immigrants from Cambodia (13.9%, a difference of 0.050%), Moroccan (13.8%, a difference of 0.16%), Immigrants from Saudi Arabia (13.9%, a difference of 0.20%), Immigrants from Germany (13.9%, a difference of 0.32%), and English (13.9%, a difference of 0.38%).
| Demographics | Rating | Rank | Female Poverty Among 25-34 Year Olds |
| Finns | 32.5 /100 | #189 | Fair 13.7% |
| Dutch | 29.7 /100 | #190 | Fair 13.8% |
| Immigrants | St. Vincent and the Grenadines | 29.3 /100 | #191 | Fair 13.8% |
| Tlingit-Haida | 28.1 /100 | #192 | Fair 13.8% |
| Immigrants | Kenya | 28.0 /100 | #193 | Fair 13.8% |
| Moroccans | 25.1 /100 | #194 | Fair 13.8% |
| Immigrants | Cambodia | 24.0 /100 | #195 | Fair 13.9% |
| Scottish | 23.6 /100 | #196 | Fair 13.9% |
| Immigrants | Saudi Arabia | 21.9 /100 | #197 | Fair 13.9% |
| Immigrants | Germany | 20.9 /100 | #198 | Fair 13.9% |
| English | 20.4 /100 | #199 | Fair 13.9% |
| Hmong | 20.3 /100 | #200 | Fair 13.9% |
| Immigrants | Trinidad and Tobago | 17.6 /100 | #201 | Poor 14.0% |
| Welsh | 17.2 /100 | #202 | Poor 14.0% |
| Immigrants | Immigrants | 14.5 /100 | #203 | Poor 14.0% |