Alsatian vs Cheyenne Female Poverty Among 25-34 Year Olds
COMPARE
Alsatian
Cheyenne
Female Poverty Among 25-34 Year Olds
Female Poverty Among 25-34 Year Olds Comparison
Alsatians
Cheyenne
14.7%
FEMALE POVERTY AMONG 25-34 YEAR OLDS
1.4/ 100
METRIC RATING
238th/ 347
METRIC RANK
19.1%
FEMALE POVERTY AMONG 25-34 YEAR OLDS
0.0/ 100
METRIC RATING
327th/ 347
METRIC RANK
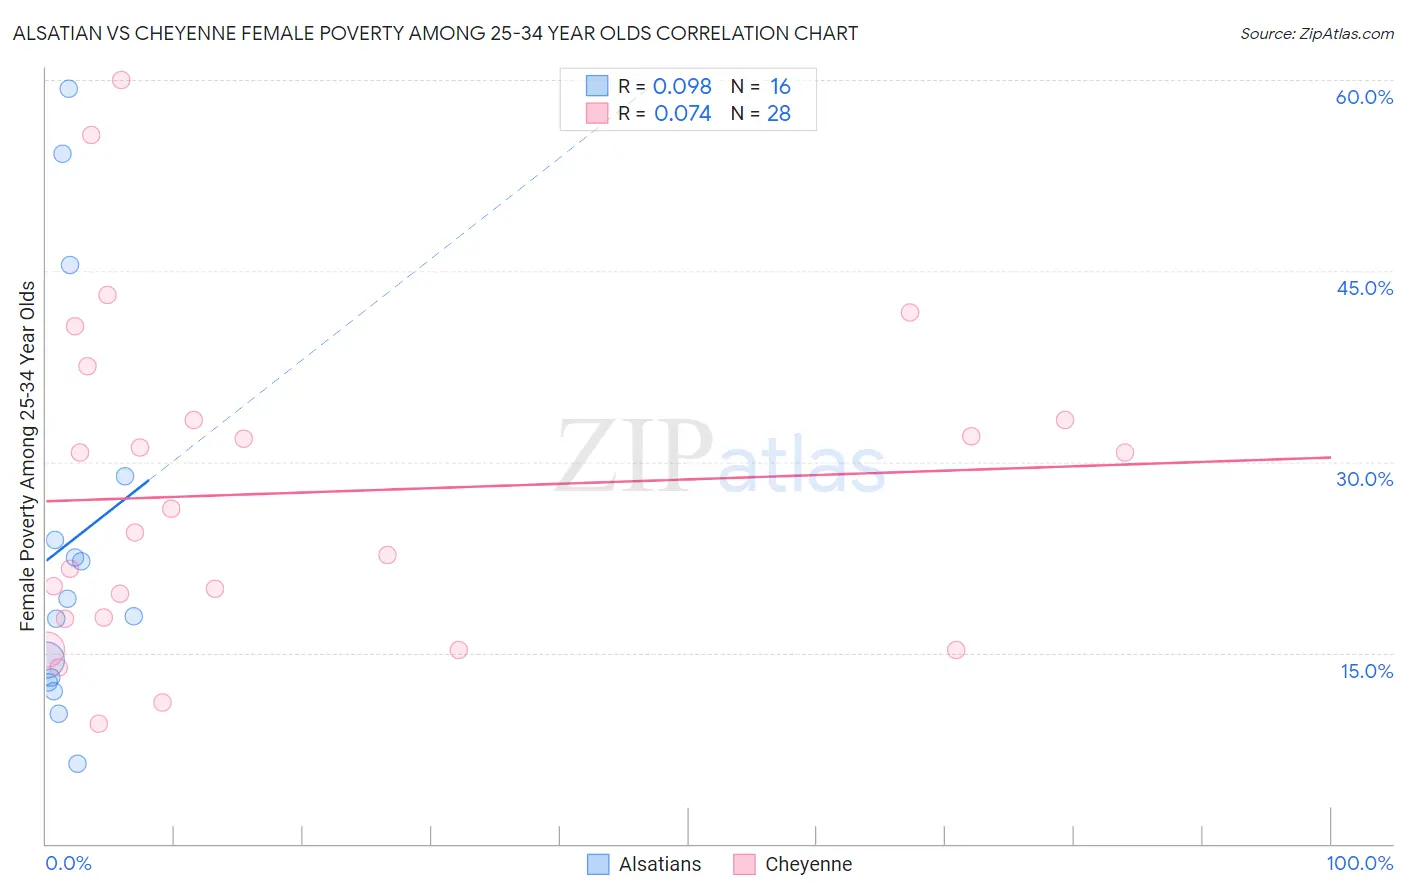
Alsatian vs Cheyenne Female Poverty Among 25-34 Year Olds Correlation Chart
The statistical analysis conducted on geographies consisting of 82,102,857 people shows a slight positive correlation between the proportion of Alsatians and poverty level among females between the ages 25 and 34 in the United States with a correlation coefficient (R) of 0.098 and weighted average of 14.7%. Similarly, the statistical analysis conducted on geographies consisting of 80,457,436 people shows a slight positive correlation between the proportion of Cheyenne and poverty level among females between the ages 25 and 34 in the United States with a correlation coefficient (R) of 0.074 and weighted average of 19.1%, a difference of 29.6%.
Female Poverty Among 25-34 Year Olds Correlation Summary
| Measurement | Alsatian | Cheyenne |
| Minimum | 6.2% | 9.4% |
| Maximum | 59.3% | 60.0% |
| Range | 53.1% | 50.6% |
| Mean | 23.7% | 27.6% |
| Median | 18.5% | 25.4% |
| Interquartile 25% (IQ1) | 12.9% | 17.7% |
| Interquartile 75% (IQ3) | 26.4% | 33.3% |
| Interquartile Range (IQR) | 13.4% | 15.6% |
| Standard Deviation (Sample) | 15.8% | 12.7% |
| Standard Deviation (Population) | 15.3% | 12.5% |
Similar Demographics by Female Poverty Among 25-34 Year Olds
Demographics Similar to Alsatians by Female Poverty Among 25-34 Year Olds
In terms of female poverty among 25-34 year olds, the demographic groups most similar to Alsatians are Malaysian (14.7%, a difference of 0.030%), Salvadoran (14.7%, a difference of 0.040%), Immigrants from Ghana (14.7%, a difference of 0.040%), Immigrants from Jamaica (14.7%, a difference of 0.060%), and Immigrants from Grenada (14.7%, a difference of 0.080%).
| Demographics | Rating | Rank | Female Poverty Among 25-34 Year Olds |
| Delaware | 2.3 /100 | #231 | Tragic 14.6% |
| Immigrants | Ecuador | 1.9 /100 | #232 | Tragic 14.6% |
| Whites/Caucasians | 1.8 /100 | #233 | Tragic 14.7% |
| Cubans | 1.6 /100 | #234 | Tragic 14.7% |
| Immigrants | Jamaica | 1.4 /100 | #235 | Tragic 14.7% |
| Salvadorans | 1.4 /100 | #236 | Tragic 14.7% |
| Immigrants | Ghana | 1.4 /100 | #237 | Tragic 14.7% |
| Alsatians | 1.4 /100 | #238 | Tragic 14.7% |
| Malaysians | 1.4 /100 | #239 | Tragic 14.7% |
| Immigrants | Grenada | 1.3 /100 | #240 | Tragic 14.7% |
| Scotch-Irish | 1.2 /100 | #241 | Tragic 14.8% |
| Barbadians | 1.2 /100 | #242 | Tragic 14.8% |
| Immigrants | Nicaragua | 1.1 /100 | #243 | Tragic 14.8% |
| Immigrants | Bangladesh | 1.1 /100 | #244 | Tragic 14.8% |
| Immigrants | Middle Africa | 1.0 /100 | #245 | Tragic 14.8% |
Demographics Similar to Cheyenne by Female Poverty Among 25-34 Year Olds
In terms of female poverty among 25-34 year olds, the demographic groups most similar to Cheyenne are Alaskan Athabascan (19.1%, a difference of 0.080%), Creek (19.2%, a difference of 0.33%), Black/African American (18.9%, a difference of 0.96%), Paiute (19.6%, a difference of 2.6%), and Kiowa (19.7%, a difference of 3.0%).
| Demographics | Rating | Rank | Female Poverty Among 25-34 Year Olds |
| Chippewa | 0.0 /100 | #320 | Tragic 18.0% |
| Choctaw | 0.0 /100 | #321 | Tragic 18.1% |
| Central American Indians | 0.0 /100 | #322 | Tragic 18.2% |
| Seminole | 0.0 /100 | #323 | Tragic 18.3% |
| Dutch West Indians | 0.0 /100 | #324 | Tragic 18.4% |
| Inupiat | 0.0 /100 | #325 | Tragic 18.5% |
| Blacks/African Americans | 0.0 /100 | #326 | Tragic 18.9% |
| Cheyenne | 0.0 /100 | #327 | Tragic 19.1% |
| Alaskan Athabascans | 0.0 /100 | #328 | Tragic 19.1% |
| Creek | 0.0 /100 | #329 | Tragic 19.2% |
| Paiute | 0.0 /100 | #330 | Tragic 19.6% |
| Kiowa | 0.0 /100 | #331 | Tragic 19.7% |
| Immigrants | Yemen | 0.0 /100 | #332 | Tragic 19.8% |
| Cajuns | 0.0 /100 | #333 | Tragic 19.9% |
| Apache | 0.0 /100 | #334 | Tragic 20.1% |