Immigrants from Eastern Africa vs Cheyenne Female Poverty Among 25-34 Year Olds
COMPARE
Immigrants from Eastern Africa
Cheyenne
Female Poverty Among 25-34 Year Olds
Female Poverty Among 25-34 Year Olds Comparison
Immigrants from Eastern Africa
Cheyenne
13.6%
FEMALE POVERTY AMONG 25-34 YEAR OLDS
43.6/ 100
METRIC RATING
179th/ 347
METRIC RANK
19.1%
FEMALE POVERTY AMONG 25-34 YEAR OLDS
0.0/ 100
METRIC RATING
327th/ 347
METRIC RANK
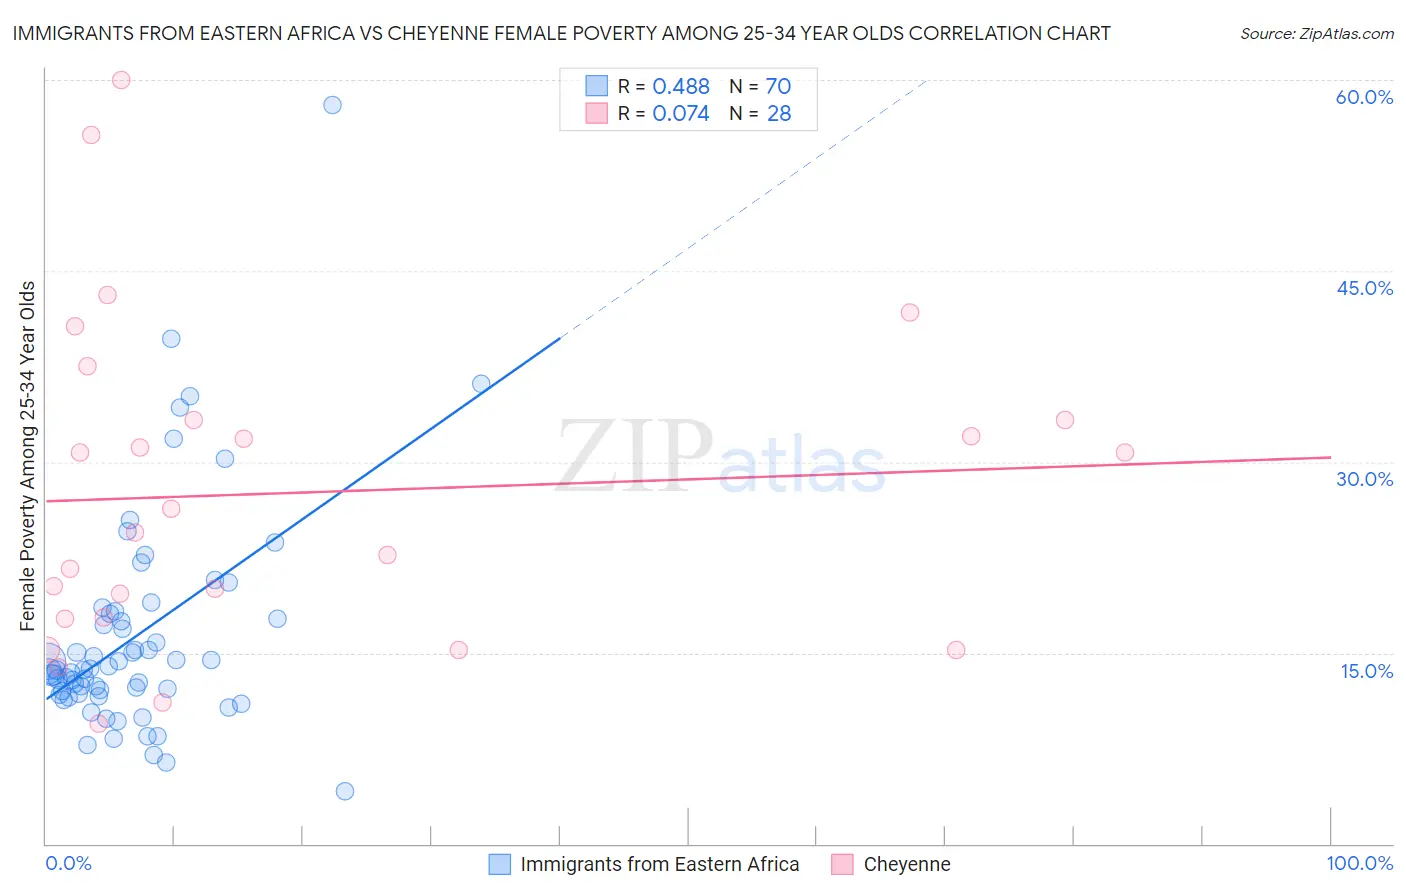
Immigrants from Eastern Africa vs Cheyenne Female Poverty Among 25-34 Year Olds Correlation Chart
The statistical analysis conducted on geographies consisting of 350,717,935 people shows a moderate positive correlation between the proportion of Immigrants from Eastern Africa and poverty level among females between the ages 25 and 34 in the United States with a correlation coefficient (R) of 0.488 and weighted average of 13.6%. Similarly, the statistical analysis conducted on geographies consisting of 80,457,436 people shows a slight positive correlation between the proportion of Cheyenne and poverty level among females between the ages 25 and 34 in the United States with a correlation coefficient (R) of 0.074 and weighted average of 19.1%, a difference of 40.3%.
Female Poverty Among 25-34 Year Olds Correlation Summary
| Measurement | Immigrants from Eastern Africa | Cheyenne |
| Minimum | 4.1% | 9.4% |
| Maximum | 58.1% | 60.0% |
| Range | 53.9% | 50.6% |
| Mean | 16.4% | 27.6% |
| Median | 13.7% | 25.4% |
| Interquartile 25% (IQ1) | 11.8% | 17.7% |
| Interquartile 75% (IQ3) | 18.1% | 33.3% |
| Interquartile Range (IQR) | 6.3% | 15.6% |
| Standard Deviation (Sample) | 8.8% | 12.7% |
| Standard Deviation (Population) | 8.7% | 12.5% |
Similar Demographics by Female Poverty Among 25-34 Year Olds
Demographics Similar to Immigrants from Eastern Africa by Female Poverty Among 25-34 Year Olds
In terms of female poverty among 25-34 year olds, the demographic groups most similar to Immigrants from Eastern Africa are Canadian (13.6%, a difference of 0.060%), Venezuelan (13.6%, a difference of 0.090%), Yugoslavian (13.6%, a difference of 0.12%), German (13.6%, a difference of 0.17%), and Guamanian/Chamorro (13.6%, a difference of 0.17%).
| Demographics | Rating | Rank | Female Poverty Among 25-34 Year Olds |
| Immigrants | Costa Rica | 51.9 /100 | #172 | Average 13.5% |
| Kenyans | 51.8 /100 | #173 | Average 13.5% |
| Immigrants | Oceania | 50.0 /100 | #174 | Average 13.5% |
| Bermudans | 46.8 /100 | #175 | Average 13.6% |
| Yugoslavians | 45.0 /100 | #176 | Average 13.6% |
| Venezuelans | 44.6 /100 | #177 | Average 13.6% |
| Canadians | 44.3 /100 | #178 | Average 13.6% |
| Immigrants | Eastern Africa | 43.6 /100 | #179 | Average 13.6% |
| Germans | 41.6 /100 | #180 | Average 13.6% |
| Guamanians/Chamorros | 41.5 /100 | #181 | Average 13.6% |
| Immigrants | Venezuela | 40.7 /100 | #182 | Average 13.6% |
| Portuguese | 40.3 /100 | #183 | Average 13.6% |
| Czechoslovakians | 36.8 /100 | #184 | Fair 13.7% |
| Irish | 35.3 /100 | #185 | Fair 13.7% |
| Immigrants | Uruguay | 34.1 /100 | #186 | Fair 13.7% |
Demographics Similar to Cheyenne by Female Poverty Among 25-34 Year Olds
In terms of female poverty among 25-34 year olds, the demographic groups most similar to Cheyenne are Alaskan Athabascan (19.1%, a difference of 0.080%), Creek (19.2%, a difference of 0.33%), Black/African American (18.9%, a difference of 0.96%), Paiute (19.6%, a difference of 2.6%), and Kiowa (19.7%, a difference of 3.0%).
| Demographics | Rating | Rank | Female Poverty Among 25-34 Year Olds |
| Chippewa | 0.0 /100 | #320 | Tragic 18.0% |
| Choctaw | 0.0 /100 | #321 | Tragic 18.1% |
| Central American Indians | 0.0 /100 | #322 | Tragic 18.2% |
| Seminole | 0.0 /100 | #323 | Tragic 18.3% |
| Dutch West Indians | 0.0 /100 | #324 | Tragic 18.4% |
| Inupiat | 0.0 /100 | #325 | Tragic 18.5% |
| Blacks/African Americans | 0.0 /100 | #326 | Tragic 18.9% |
| Cheyenne | 0.0 /100 | #327 | Tragic 19.1% |
| Alaskan Athabascans | 0.0 /100 | #328 | Tragic 19.1% |
| Creek | 0.0 /100 | #329 | Tragic 19.2% |
| Paiute | 0.0 /100 | #330 | Tragic 19.6% |
| Kiowa | 0.0 /100 | #331 | Tragic 19.7% |
| Immigrants | Yemen | 0.0 /100 | #332 | Tragic 19.8% |
| Cajuns | 0.0 /100 | #333 | Tragic 19.9% |
| Apache | 0.0 /100 | #334 | Tragic 20.1% |