Yuman vs Osage Female Poverty Among 25-34 Year Olds
COMPARE
Yuman
Osage
Female Poverty Among 25-34 Year Olds
Female Poverty Among 25-34 Year Olds Comparison
Yuman
Osage
22.9%
FEMALE POVERTY AMONG 25-34 YEAR OLDS
0.0/ 100
METRIC RATING
339th/ 347
METRIC RANK
16.4%
FEMALE POVERTY AMONG 25-34 YEAR OLDS
0.0/ 100
METRIC RATING
289th/ 347
METRIC RANK
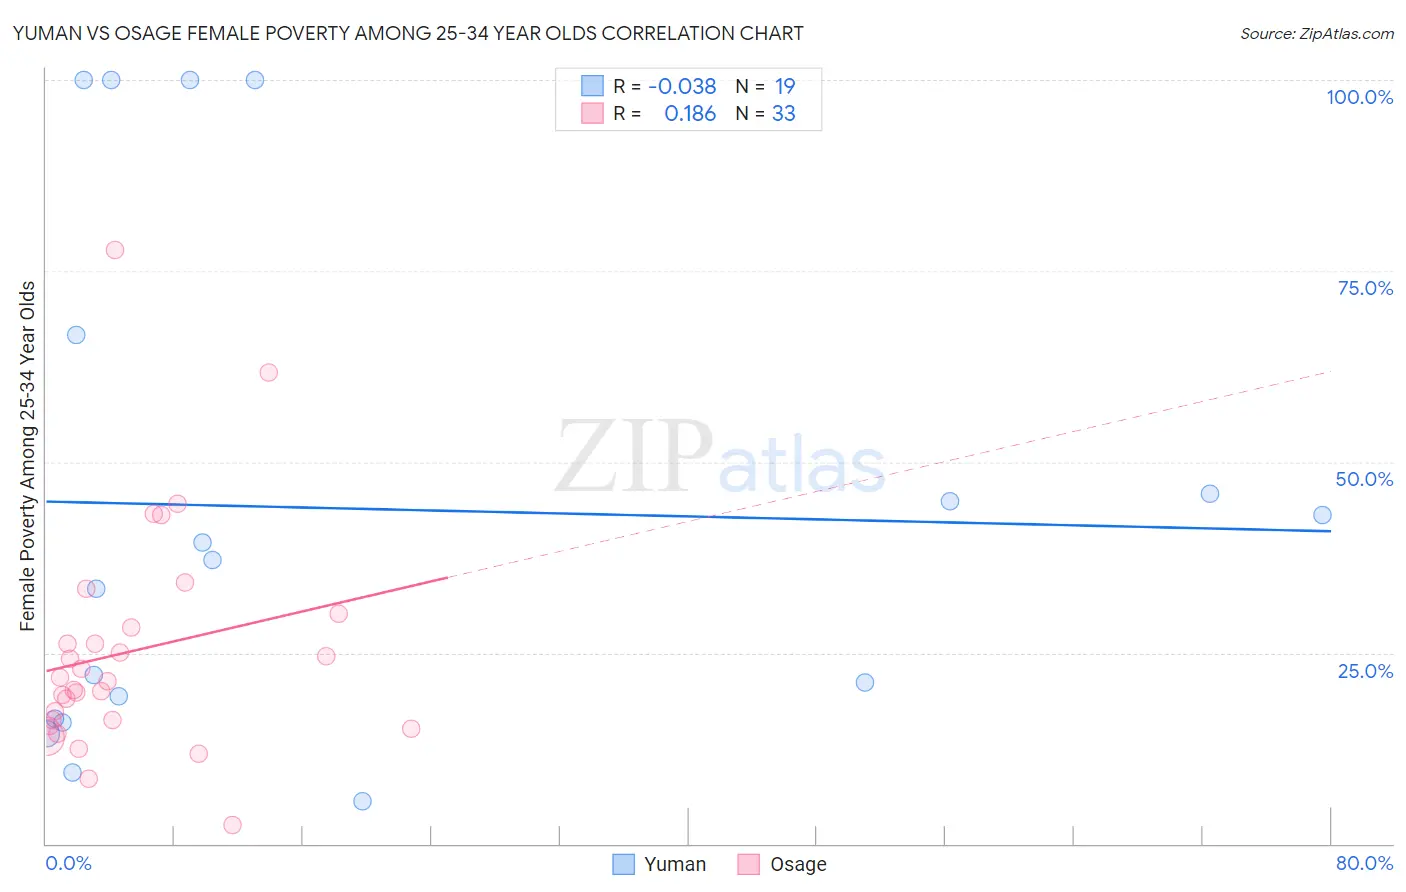
Yuman vs Osage Female Poverty Among 25-34 Year Olds Correlation Chart
The statistical analysis conducted on geographies consisting of 40,634,660 people shows no correlation between the proportion of Yuman and poverty level among females between the ages 25 and 34 in the United States with a correlation coefficient (R) of -0.038 and weighted average of 22.9%. Similarly, the statistical analysis conducted on geographies consisting of 91,487,860 people shows a poor positive correlation between the proportion of Osage and poverty level among females between the ages 25 and 34 in the United States with a correlation coefficient (R) of 0.186 and weighted average of 16.4%, a difference of 39.8%.
Female Poverty Among 25-34 Year Olds Correlation Summary
| Measurement | Yuman | Osage |
| Minimum | 5.6% | 2.4% |
| Maximum | 100.0% | 77.8% |
| Range | 94.4% | 75.3% |
| Mean | 43.9% | 25.2% |
| Median | 37.2% | 21.3% |
| Interquartile 25% (IQ1) | 16.4% | 15.8% |
| Interquartile 75% (IQ3) | 66.7% | 29.3% |
| Interquartile Range (IQR) | 50.3% | 13.5% |
| Standard Deviation (Sample) | 33.3% | 15.1% |
| Standard Deviation (Population) | 32.4% | 14.9% |
Similar Demographics by Female Poverty Among 25-34 Year Olds
Demographics Similar to Yuman by Female Poverty Among 25-34 Year Olds
In terms of female poverty among 25-34 year olds, the demographic groups most similar to Yuman are Sioux (23.0%, a difference of 0.18%), Houma (22.7%, a difference of 0.85%), Crow (22.7%, a difference of 1.0%), Navajo (23.3%, a difference of 1.9%), and Hopi (23.7%, a difference of 3.3%).
| Demographics | Rating | Rank | Female Poverty Among 25-34 Year Olds |
| Immigrants | Yemen | 0.0 /100 | #332 | Tragic 19.8% |
| Cajuns | 0.0 /100 | #333 | Tragic 19.9% |
| Apache | 0.0 /100 | #334 | Tragic 20.1% |
| Natives/Alaskans | 0.0 /100 | #335 | Tragic 20.3% |
| Pueblo | 0.0 /100 | #336 | Tragic 22.2% |
| Crow | 0.0 /100 | #337 | Tragic 22.7% |
| Houma | 0.0 /100 | #338 | Tragic 22.7% |
| Yuman | 0.0 /100 | #339 | Tragic 22.9% |
| Sioux | 0.0 /100 | #340 | Tragic 23.0% |
| Navajo | 0.0 /100 | #341 | Tragic 23.3% |
| Hopi | 0.0 /100 | #342 | Tragic 23.7% |
| Yup'ik | 0.0 /100 | #343 | Tragic 24.3% |
| Tohono O'odham | 0.0 /100 | #344 | Tragic 24.7% |
| Pima | 0.0 /100 | #345 | Tragic 25.3% |
| Lumbee | 0.0 /100 | #346 | Tragic 26.3% |
Demographics Similar to Osage by Female Poverty Among 25-34 Year Olds
In terms of female poverty among 25-34 year olds, the demographic groups most similar to Osage are Guatemalan (16.4%, a difference of 0.060%), Indonesian (16.4%, a difference of 0.16%), American (16.4%, a difference of 0.25%), Cape Verdean (16.3%, a difference of 0.30%), and Comanche (16.5%, a difference of 0.44%).
| Demographics | Rating | Rank | Female Poverty Among 25-34 Year Olds |
| Aleuts | 0.0 /100 | #282 | Tragic 16.1% |
| Bahamians | 0.0 /100 | #283 | Tragic 16.1% |
| Shoshone | 0.0 /100 | #284 | Tragic 16.2% |
| Immigrants | Bahamas | 0.0 /100 | #285 | Tragic 16.3% |
| Cape Verdeans | 0.0 /100 | #286 | Tragic 16.3% |
| Americans | 0.0 /100 | #287 | Tragic 16.4% |
| Guatemalans | 0.0 /100 | #288 | Tragic 16.4% |
| Osage | 0.0 /100 | #289 | Tragic 16.4% |
| Indonesians | 0.0 /100 | #290 | Tragic 16.4% |
| Comanche | 0.0 /100 | #291 | Tragic 16.5% |
| Immigrants | Dominica | 0.0 /100 | #292 | Tragic 16.5% |
| Potawatomi | 0.0 /100 | #293 | Tragic 16.5% |
| Immigrants | Central America | 0.0 /100 | #294 | Tragic 16.6% |
| Mexicans | 0.0 /100 | #295 | Tragic 16.6% |
| Hispanics or Latinos | 0.0 /100 | #296 | Tragic 16.6% |