Yugoslavian vs Somali Single Mother Poverty
COMPARE
Yugoslavian
Somali
Single Mother Poverty
Single Mother Poverty Comparison
Yugoslavians
Somalis
29.4%
SINGLE MOTHER POVERTY
36.0/ 100
METRIC RATING
186th/ 347
METRIC RANK
32.6%
SINGLE MOTHER POVERTY
0.0/ 100
METRIC RATING
288th/ 347
METRIC RANK
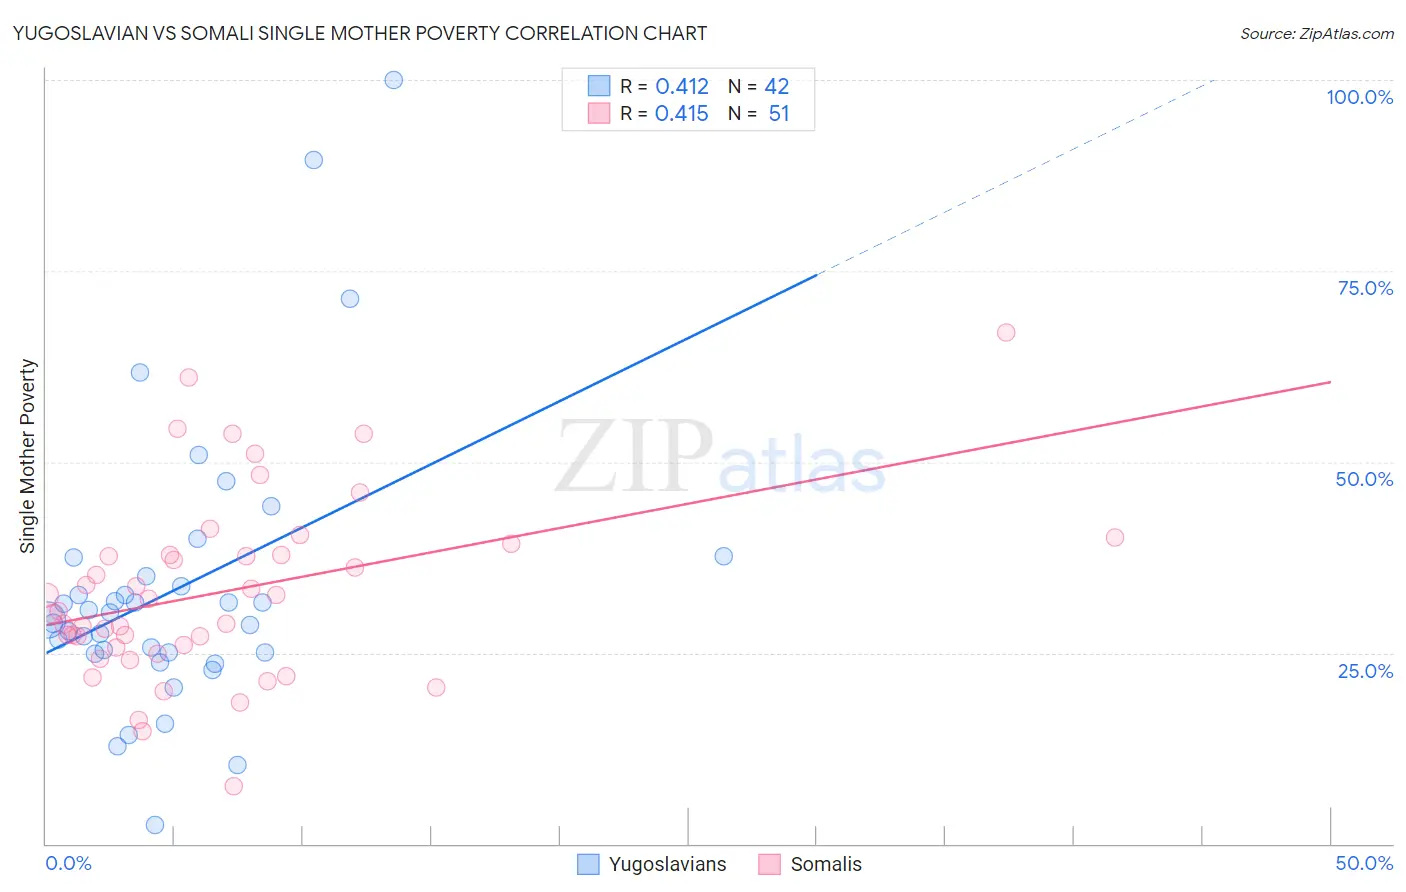
Yugoslavian vs Somali Single Mother Poverty Correlation Chart
The statistical analysis conducted on geographies consisting of 280,794,338 people shows a moderate positive correlation between the proportion of Yugoslavians and poverty level among single mothers in the United States with a correlation coefficient (R) of 0.412 and weighted average of 29.4%. Similarly, the statistical analysis conducted on geographies consisting of 98,871,600 people shows a moderate positive correlation between the proportion of Somalis and poverty level among single mothers in the United States with a correlation coefficient (R) of 0.415 and weighted average of 32.6%, a difference of 10.9%.
Single Mother Poverty Correlation Summary
| Measurement | Yugoslavian | Somali |
| Minimum | 2.5% | 7.5% |
| Maximum | 100.0% | 66.9% |
| Range | 97.5% | 59.4% |
| Mean | 33.4% | 33.0% |
| Median | 29.7% | 30.4% |
| Interquartile 25% (IQ1) | 25.0% | 25.7% |
| Interquartile 75% (IQ3) | 35.0% | 37.9% |
| Interquartile Range (IQR) | 10.0% | 12.2% |
| Standard Deviation (Sample) | 18.6% | 11.9% |
| Standard Deviation (Population) | 18.4% | 11.8% |
Similar Demographics by Single Mother Poverty
Demographics Similar to Yugoslavians by Single Mother Poverty
In terms of single mother poverty, the demographic groups most similar to Yugoslavians are Ghanaian (29.4%, a difference of 0.040%), Nigerian (29.3%, a difference of 0.10%), Nepalese (29.3%, a difference of 0.11%), Immigrants from Eastern Africa (29.3%, a difference of 0.13%), and Lebanese (29.4%, a difference of 0.19%).
| Demographics | Rating | Rank | Single Mother Poverty |
| Immigrants | Uzbekistan | 42.6 /100 | #179 | Average 29.3% |
| Immigrants | Norway | 41.5 /100 | #180 | Average 29.3% |
| Canadians | 40.4 /100 | #181 | Average 29.3% |
| Immigrants | Eastern Africa | 38.5 /100 | #182 | Fair 29.3% |
| Nepalese | 38.3 /100 | #183 | Fair 29.3% |
| Nigerians | 38.0 /100 | #184 | Fair 29.3% |
| Ghanaians | 36.8 /100 | #185 | Fair 29.4% |
| Yugoslavians | 36.0 /100 | #186 | Fair 29.4% |
| Lebanese | 32.5 /100 | #187 | Fair 29.4% |
| Guamanians/Chamorros | 31.8 /100 | #188 | Fair 29.4% |
| Immigrants | Africa | 31.6 /100 | #189 | Fair 29.4% |
| Immigrants | Germany | 30.4 /100 | #190 | Fair 29.5% |
| Immigrants | Trinidad and Tobago | 29.2 /100 | #191 | Fair 29.5% |
| Moroccans | 28.6 /100 | #192 | Fair 29.5% |
| Basques | 28.3 /100 | #193 | Fair 29.5% |
Demographics Similar to Somalis by Single Mother Poverty
In terms of single mother poverty, the demographic groups most similar to Somalis are U.S. Virgin Islander (32.6%, a difference of 0.030%), Osage (32.6%, a difference of 0.14%), Immigrants from Dominica (32.5%, a difference of 0.23%), Yup'ik (32.5%, a difference of 0.35%), and Immigrants from Latin America (32.4%, a difference of 0.43%).
| Demographics | Rating | Rank | Single Mother Poverty |
| Cree | 0.0 /100 | #281 | Tragic 32.2% |
| Immigrants | Azores | 0.0 /100 | #282 | Tragic 32.2% |
| Spanish Americans | 0.0 /100 | #283 | Tragic 32.3% |
| Indonesians | 0.0 /100 | #284 | Tragic 32.4% |
| Immigrants | Latin America | 0.0 /100 | #285 | Tragic 32.4% |
| Yup'ik | 0.0 /100 | #286 | Tragic 32.5% |
| Immigrants | Dominica | 0.0 /100 | #287 | Tragic 32.5% |
| Somalis | 0.0 /100 | #288 | Tragic 32.6% |
| U.S. Virgin Islanders | 0.0 /100 | #289 | Tragic 32.6% |
| Osage | 0.0 /100 | #290 | Tragic 32.6% |
| Guatemalans | 0.0 /100 | #291 | Tragic 32.9% |
| Shoshone | 0.0 /100 | #292 | Tragic 32.9% |
| Aleuts | 0.0 /100 | #293 | Tragic 32.9% |
| French American Indians | 0.0 /100 | #294 | Tragic 33.1% |
| Yaqui | 0.0 /100 | #295 | Tragic 33.1% |