Yugoslavian vs Venezuelan Single Mother Poverty
COMPARE
Yugoslavian
Venezuelan
Single Mother Poverty
Single Mother Poverty Comparison
Yugoslavians
Venezuelans
29.4%
SINGLE MOTHER POVERTY
36.0/ 100
METRIC RATING
186th/ 347
METRIC RANK
28.2%
SINGLE MOTHER POVERTY
94.5/ 100
METRIC RATING
111th/ 347
METRIC RANK
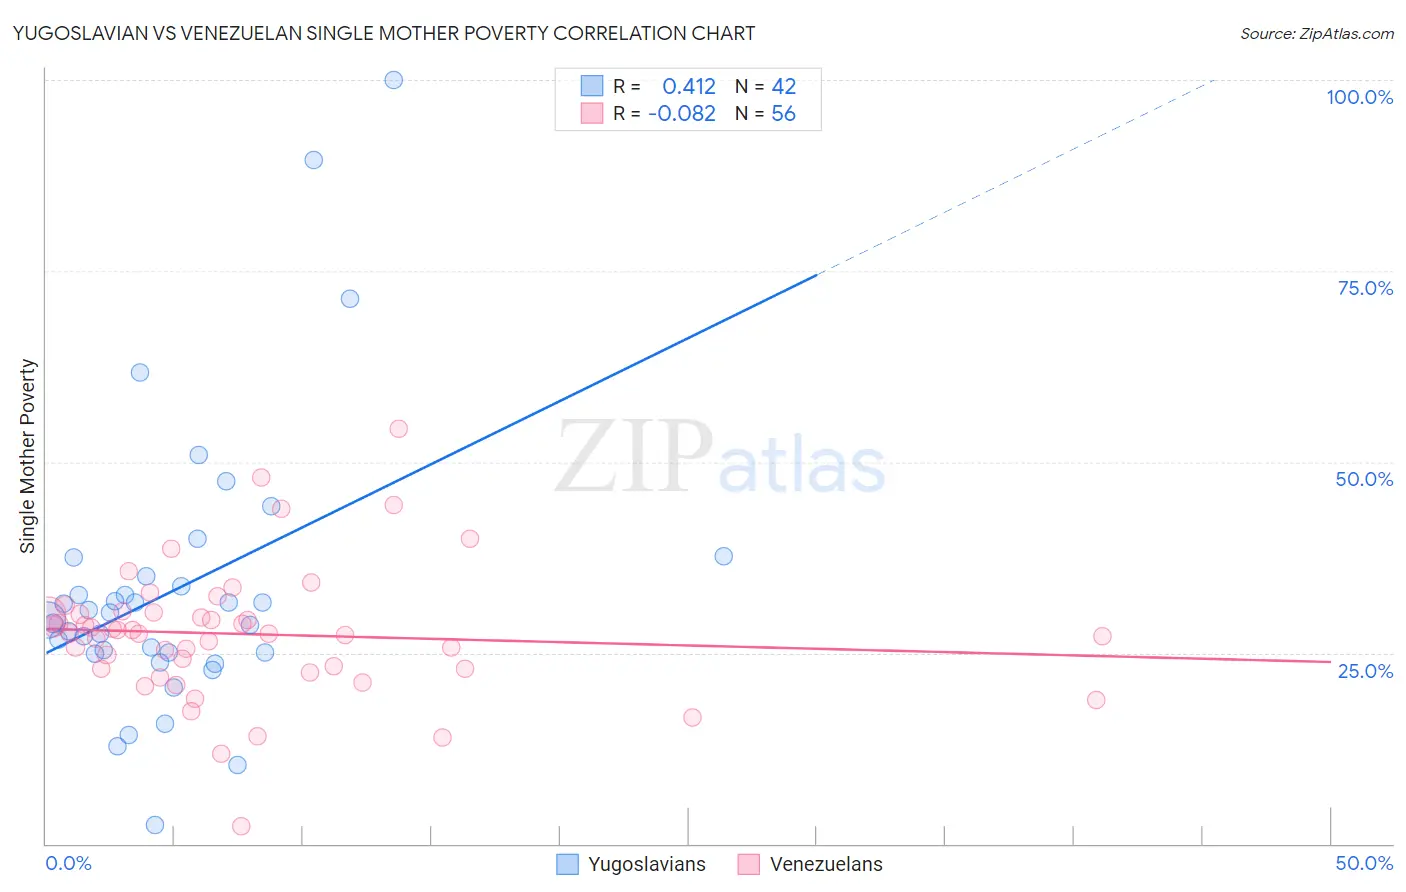
Yugoslavian vs Venezuelan Single Mother Poverty Correlation Chart
The statistical analysis conducted on geographies consisting of 280,794,338 people shows a moderate positive correlation between the proportion of Yugoslavians and poverty level among single mothers in the United States with a correlation coefficient (R) of 0.412 and weighted average of 29.4%. Similarly, the statistical analysis conducted on geographies consisting of 301,183,109 people shows a slight negative correlation between the proportion of Venezuelans and poverty level among single mothers in the United States with a correlation coefficient (R) of -0.082 and weighted average of 28.2%, a difference of 4.2%.
Single Mother Poverty Correlation Summary
| Measurement | Yugoslavian | Venezuelan |
| Minimum | 2.5% | 2.4% |
| Maximum | 100.0% | 54.3% |
| Range | 97.5% | 51.9% |
| Mean | 33.4% | 27.4% |
| Median | 29.7% | 27.6% |
| Interquartile 25% (IQ1) | 25.0% | 22.9% |
| Interquartile 75% (IQ3) | 35.0% | 30.2% |
| Interquartile Range (IQR) | 10.0% | 7.3% |
| Standard Deviation (Sample) | 18.6% | 8.7% |
| Standard Deviation (Population) | 18.4% | 8.6% |
Similar Demographics by Single Mother Poverty
Demographics Similar to Yugoslavians by Single Mother Poverty
In terms of single mother poverty, the demographic groups most similar to Yugoslavians are Ghanaian (29.4%, a difference of 0.040%), Nigerian (29.3%, a difference of 0.10%), Nepalese (29.3%, a difference of 0.11%), Immigrants from Eastern Africa (29.3%, a difference of 0.13%), and Lebanese (29.4%, a difference of 0.19%).
| Demographics | Rating | Rank | Single Mother Poverty |
| Immigrants | Uzbekistan | 42.6 /100 | #179 | Average 29.3% |
| Immigrants | Norway | 41.5 /100 | #180 | Average 29.3% |
| Canadians | 40.4 /100 | #181 | Average 29.3% |
| Immigrants | Eastern Africa | 38.5 /100 | #182 | Fair 29.3% |
| Nepalese | 38.3 /100 | #183 | Fair 29.3% |
| Nigerians | 38.0 /100 | #184 | Fair 29.3% |
| Ghanaians | 36.8 /100 | #185 | Fair 29.4% |
| Yugoslavians | 36.0 /100 | #186 | Fair 29.4% |
| Lebanese | 32.5 /100 | #187 | Fair 29.4% |
| Guamanians/Chamorros | 31.8 /100 | #188 | Fair 29.4% |
| Immigrants | Africa | 31.6 /100 | #189 | Fair 29.4% |
| Immigrants | Germany | 30.4 /100 | #190 | Fair 29.5% |
| Immigrants | Trinidad and Tobago | 29.2 /100 | #191 | Fair 29.5% |
| Moroccans | 28.6 /100 | #192 | Fair 29.5% |
| Basques | 28.3 /100 | #193 | Fair 29.5% |
Demographics Similar to Venezuelans by Single Mother Poverty
In terms of single mother poverty, the demographic groups most similar to Venezuelans are Immigrants from Kazakhstan (28.2%, a difference of 0.010%), Croatian (28.2%, a difference of 0.050%), Immigrants from Armenia (28.1%, a difference of 0.17%), Immigrants from Zimbabwe (28.1%, a difference of 0.26%), and Immigrants from South Africa (28.3%, a difference of 0.29%).
| Demographics | Rating | Rank | Single Mother Poverty |
| Italians | 96.6 /100 | #104 | Exceptional 28.0% |
| Israelis | 96.5 /100 | #105 | Exceptional 28.0% |
| Ukrainians | 96.4 /100 | #106 | Exceptional 28.0% |
| Immigrants | Venezuela | 95.8 /100 | #107 | Exceptional 28.1% |
| Immigrants | Zimbabwe | 95.5 /100 | #108 | Exceptional 28.1% |
| Immigrants | Armenia | 95.2 /100 | #109 | Exceptional 28.1% |
| Croatians | 94.8 /100 | #110 | Exceptional 28.2% |
| Venezuelans | 94.5 /100 | #111 | Exceptional 28.2% |
| Immigrants | Kazakhstan | 94.5 /100 | #112 | Exceptional 28.2% |
| Immigrants | South Africa | 93.2 /100 | #113 | Exceptional 28.3% |
| Immigrants | Western Asia | 92.7 /100 | #114 | Exceptional 28.3% |
| Immigrants | Kuwait | 92.7 /100 | #115 | Exceptional 28.3% |
| Immigrants | Uganda | 92.5 /100 | #116 | Exceptional 28.3% |
| Australians | 92.5 /100 | #117 | Exceptional 28.3% |
| Brazilians | 92.4 /100 | #118 | Exceptional 28.3% |