Yugoslavian vs Bahamian Single Mother Poverty
COMPARE
Yugoslavian
Bahamian
Single Mother Poverty
Single Mother Poverty Comparison
Yugoslavians
Bahamians
29.4%
SINGLE MOTHER POVERTY
36.0/ 100
METRIC RATING
186th/ 347
METRIC RANK
31.3%
SINGLE MOTHER POVERTY
0.2/ 100
METRIC RATING
263rd/ 347
METRIC RANK
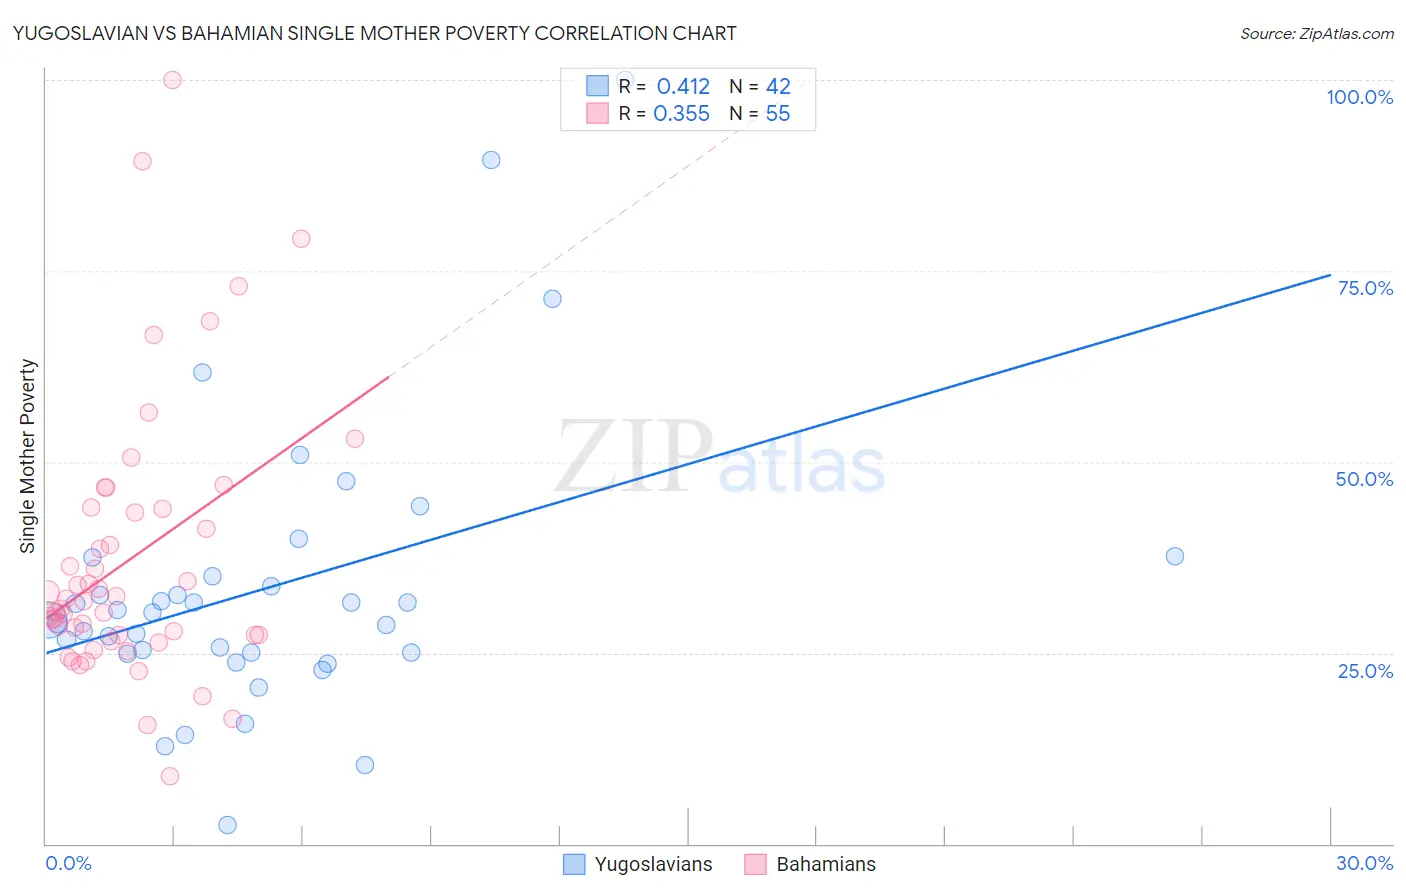
Yugoslavian vs Bahamian Single Mother Poverty Correlation Chart
The statistical analysis conducted on geographies consisting of 280,794,338 people shows a moderate positive correlation between the proportion of Yugoslavians and poverty level among single mothers in the United States with a correlation coefficient (R) of 0.412 and weighted average of 29.4%. Similarly, the statistical analysis conducted on geographies consisting of 111,917,483 people shows a mild positive correlation between the proportion of Bahamians and poverty level among single mothers in the United States with a correlation coefficient (R) of 0.355 and weighted average of 31.3%, a difference of 6.7%.
Single Mother Poverty Correlation Summary
| Measurement | Yugoslavian | Bahamian |
| Minimum | 2.5% | 8.9% |
| Maximum | 100.0% | 100.0% |
| Range | 97.5% | 91.1% |
| Mean | 33.4% | 37.3% |
| Median | 29.7% | 31.8% |
| Interquartile 25% (IQ1) | 25.0% | 27.3% |
| Interquartile 75% (IQ3) | 35.0% | 43.8% |
| Interquartile Range (IQR) | 10.0% | 16.6% |
| Standard Deviation (Sample) | 18.6% | 17.9% |
| Standard Deviation (Population) | 18.4% | 17.8% |
Similar Demographics by Single Mother Poverty
Demographics Similar to Yugoslavians by Single Mother Poverty
In terms of single mother poverty, the demographic groups most similar to Yugoslavians are Ghanaian (29.4%, a difference of 0.040%), Nigerian (29.3%, a difference of 0.10%), Nepalese (29.3%, a difference of 0.11%), Immigrants from Eastern Africa (29.3%, a difference of 0.13%), and Lebanese (29.4%, a difference of 0.19%).
| Demographics | Rating | Rank | Single Mother Poverty |
| Immigrants | Uzbekistan | 42.6 /100 | #179 | Average 29.3% |
| Immigrants | Norway | 41.5 /100 | #180 | Average 29.3% |
| Canadians | 40.4 /100 | #181 | Average 29.3% |
| Immigrants | Eastern Africa | 38.5 /100 | #182 | Fair 29.3% |
| Nepalese | 38.3 /100 | #183 | Fair 29.3% |
| Nigerians | 38.0 /100 | #184 | Fair 29.3% |
| Ghanaians | 36.8 /100 | #185 | Fair 29.4% |
| Yugoslavians | 36.0 /100 | #186 | Fair 29.4% |
| Lebanese | 32.5 /100 | #187 | Fair 29.4% |
| Guamanians/Chamorros | 31.8 /100 | #188 | Fair 29.4% |
| Immigrants | Africa | 31.6 /100 | #189 | Fair 29.4% |
| Immigrants | Germany | 30.4 /100 | #190 | Fair 29.5% |
| Immigrants | Trinidad and Tobago | 29.2 /100 | #191 | Fair 29.5% |
| Moroccans | 28.6 /100 | #192 | Fair 29.5% |
| Basques | 28.3 /100 | #193 | Fair 29.5% |
Demographics Similar to Bahamians by Single Mother Poverty
In terms of single mother poverty, the demographic groups most similar to Bahamians are Immigrants from Ecuador (31.3%, a difference of 0.020%), German Russian (31.3%, a difference of 0.040%), Subsaharan African (31.4%, a difference of 0.11%), Immigrants from Belize (31.4%, a difference of 0.26%), and Hmong (31.2%, a difference of 0.27%).
| Demographics | Rating | Rank | Single Mother Poverty |
| Immigrants | West Indies | 0.4 /100 | #256 | Tragic 31.1% |
| Immigrants | Bahamas | 0.4 /100 | #257 | Tragic 31.1% |
| Immigrants | Caribbean | 0.4 /100 | #258 | Tragic 31.1% |
| Immigrants | Bangladesh | 0.4 /100 | #259 | Tragic 31.1% |
| Whites/Caucasians | 0.3 /100 | #260 | Tragic 31.2% |
| Immigrants | El Salvador | 0.3 /100 | #261 | Tragic 31.2% |
| Hmong | 0.3 /100 | #262 | Tragic 31.2% |
| Bahamians | 0.2 /100 | #263 | Tragic 31.3% |
| Immigrants | Ecuador | 0.2 /100 | #264 | Tragic 31.3% |
| German Russians | 0.2 /100 | #265 | Tragic 31.3% |
| Sub-Saharan Africans | 0.2 /100 | #266 | Tragic 31.4% |
| Immigrants | Belize | 0.2 /100 | #267 | Tragic 31.4% |
| Immigrants | Senegal | 0.1 /100 | #268 | Tragic 31.5% |
| Scotch-Irish | 0.1 /100 | #269 | Tragic 31.5% |
| British West Indians | 0.1 /100 | #270 | Tragic 31.5% |