Yugoslavian vs Russian Male Poverty
COMPARE
Yugoslavian
Russian
Male Poverty
Male Poverty Comparison
Yugoslavians
Russians
10.8%
MALE POVERTY
78.2/ 100
METRIC RATING
138th/ 347
METRIC RANK
9.9%
MALE POVERTY
99.2/ 100
METRIC RATING
39th/ 347
METRIC RANK
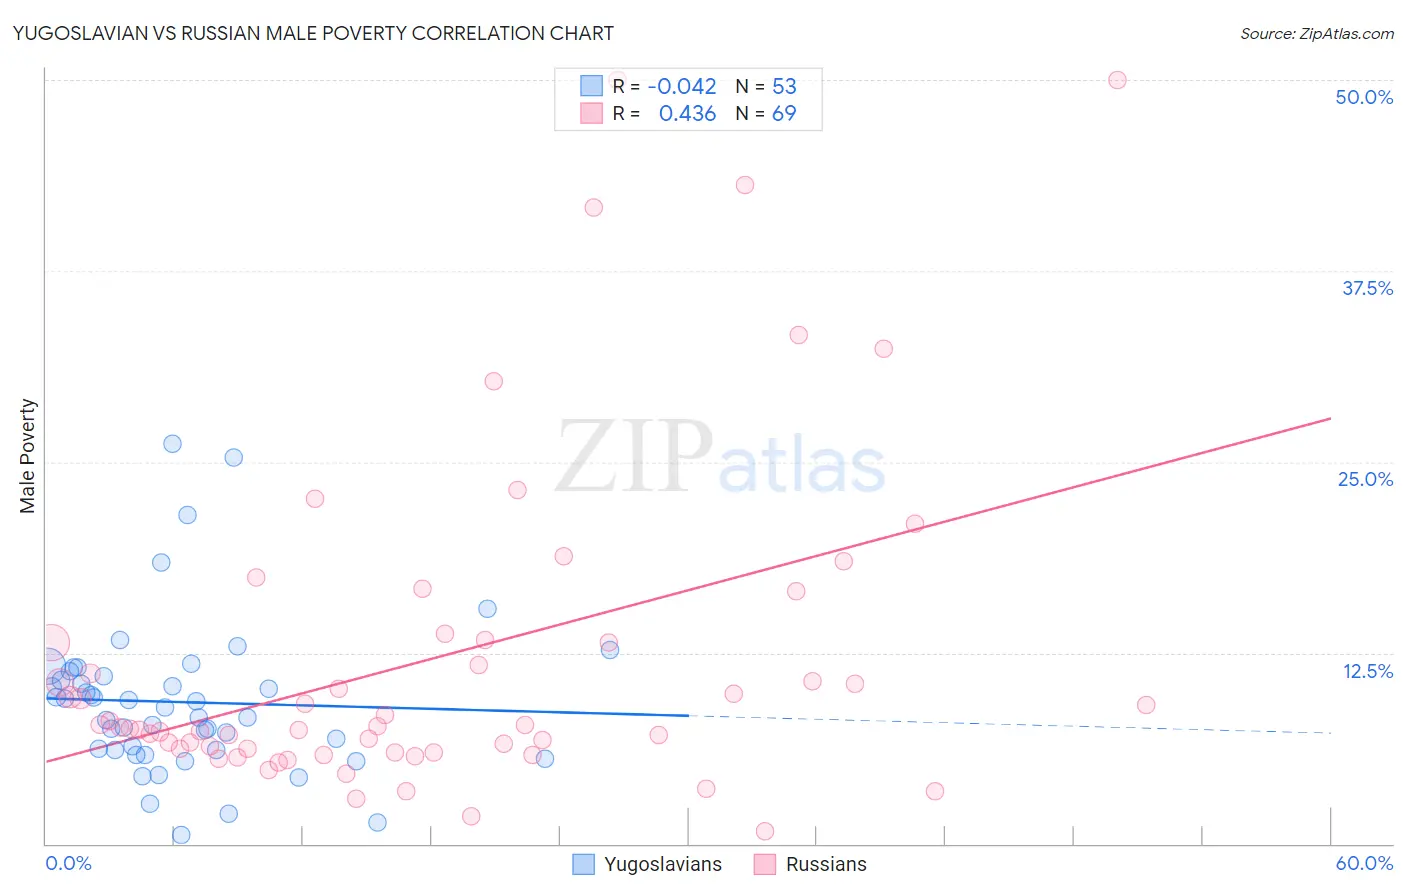
Yugoslavian vs Russian Male Poverty Correlation Chart
The statistical analysis conducted on geographies consisting of 285,576,958 people shows no correlation between the proportion of Yugoslavians and poverty level among males in the United States with a correlation coefficient (R) of -0.042 and weighted average of 10.8%. Similarly, the statistical analysis conducted on geographies consisting of 511,199,815 people shows a moderate positive correlation between the proportion of Russians and poverty level among males in the United States with a correlation coefficient (R) of 0.436 and weighted average of 9.9%, a difference of 10.0%.
Male Poverty Correlation Summary
| Measurement | Yugoslavian | Russian |
| Minimum | 0.59% | 0.81% |
| Maximum | 26.2% | 50.0% |
| Range | 25.6% | 49.2% |
| Mean | 9.3% | 12.1% |
| Median | 8.9% | 7.7% |
| Interquartile 25% (IQ1) | 6.1% | 6.1% |
| Interquartile 75% (IQ3) | 11.1% | 13.3% |
| Interquartile Range (IQR) | 5.0% | 7.2% |
| Standard Deviation (Sample) | 5.1% | 10.8% |
| Standard Deviation (Population) | 5.0% | 10.8% |
Similar Demographics by Male Poverty
Demographics Similar to Yugoslavians by Male Poverty
In terms of male poverty, the demographic groups most similar to Yugoslavians are Immigrants from Jordan (10.8%, a difference of 0.12%), Immigrants from Switzerland (10.8%, a difference of 0.15%), Tlingit-Haida (10.9%, a difference of 0.31%), Immigrants from France (10.9%, a difference of 0.34%), and Immigrants from Israel (10.8%, a difference of 0.42%).
| Demographics | Rating | Rank | Male Poverty |
| Immigrants | Belarus | 83.3 /100 | #131 | Excellent 10.7% |
| Immigrants | Vietnam | 83.0 /100 | #132 | Excellent 10.8% |
| Pakistanis | 83.0 /100 | #133 | Excellent 10.8% |
| New Zealanders | 82.9 /100 | #134 | Excellent 10.8% |
| Brazilians | 82.7 /100 | #135 | Excellent 10.8% |
| Immigrants | Israel | 80.9 /100 | #136 | Excellent 10.8% |
| Immigrants | Switzerland | 79.2 /100 | #137 | Good 10.8% |
| Yugoslavians | 78.2 /100 | #138 | Good 10.8% |
| Immigrants | Jordan | 77.5 /100 | #139 | Good 10.8% |
| Tlingit-Haida | 76.1 /100 | #140 | Good 10.9% |
| Immigrants | France | 75.8 /100 | #141 | Good 10.9% |
| Basques | 74.6 /100 | #142 | Good 10.9% |
| Afghans | 71.9 /100 | #143 | Good 10.9% |
| Samoans | 71.8 /100 | #144 | Good 10.9% |
| Immigrants | Germany | 71.6 /100 | #145 | Good 10.9% |
Demographics Similar to Russians by Male Poverty
In terms of male poverty, the demographic groups most similar to Russians are Immigrants from Pakistan (9.9%, a difference of 0.010%), Cypriot (9.9%, a difference of 0.080%), Korean (9.9%, a difference of 0.17%), Immigrants from Greece (9.8%, a difference of 0.38%), and Immigrants from Iran (9.9%, a difference of 0.42%).
| Demographics | Rating | Rank | Male Poverty |
| Macedonians | 99.5 /100 | #32 | Exceptional 9.7% |
| Immigrants | Northern Europe | 99.5 /100 | #33 | Exceptional 9.7% |
| Immigrants | Poland | 99.5 /100 | #34 | Exceptional 9.8% |
| Iranians | 99.4 /100 | #35 | Exceptional 9.8% |
| Czechs | 99.4 /100 | #36 | Exceptional 9.8% |
| Immigrants | Greece | 99.3 /100 | #37 | Exceptional 9.8% |
| Immigrants | Pakistan | 99.2 /100 | #38 | Exceptional 9.9% |
| Russians | 99.2 /100 | #39 | Exceptional 9.9% |
| Cypriots | 99.2 /100 | #40 | Exceptional 9.9% |
| Koreans | 99.2 /100 | #41 | Exceptional 9.9% |
| Immigrants | Iran | 99.1 /100 | #42 | Exceptional 9.9% |
| Immigrants | Moldova | 99.0 /100 | #43 | Exceptional 9.9% |
| Immigrants | Romania | 98.9 /100 | #44 | Exceptional 9.9% |
| Immigrants | Serbia | 98.9 /100 | #45 | Exceptional 10.0% |
| Turks | 98.9 /100 | #46 | Exceptional 10.0% |