Korean vs Russian Male Poverty
COMPARE
Korean
Russian
Male Poverty
Male Poverty Comparison
Koreans
Russians
9.9%
MALE POVERTY
99.2/ 100
METRIC RATING
41st/ 347
METRIC RANK
9.9%
MALE POVERTY
99.2/ 100
METRIC RATING
39th/ 347
METRIC RANK
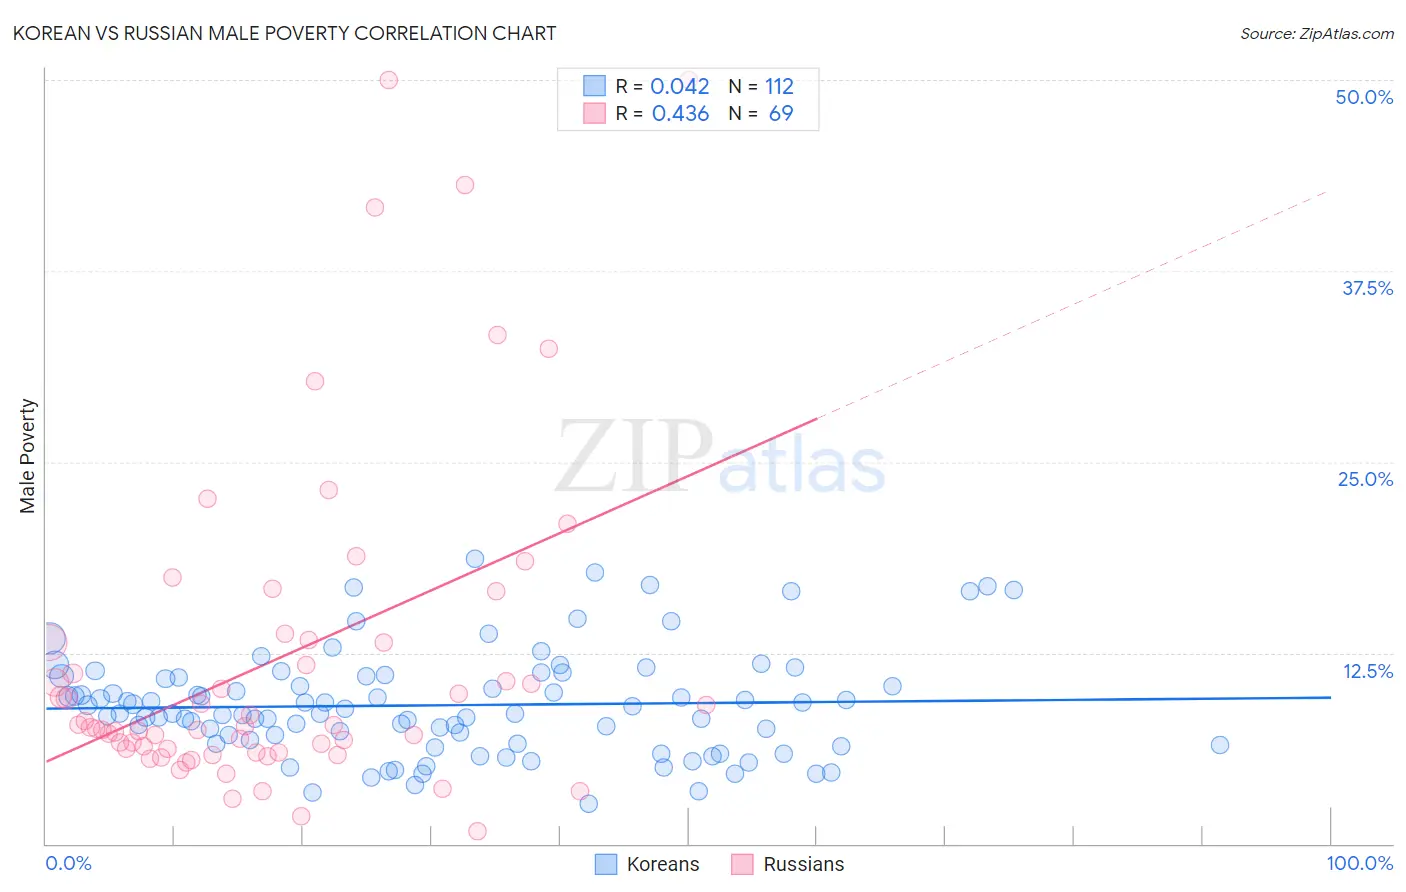
Korean vs Russian Male Poverty Correlation Chart
The statistical analysis conducted on geographies consisting of 510,064,453 people shows no correlation between the proportion of Koreans and poverty level among males in the United States with a correlation coefficient (R) of 0.042 and weighted average of 9.9%. Similarly, the statistical analysis conducted on geographies consisting of 511,199,815 people shows a moderate positive correlation between the proportion of Russians and poverty level among males in the United States with a correlation coefficient (R) of 0.436 and weighted average of 9.9%, a difference of 0.17%.
Male Poverty Correlation Summary
| Measurement | Korean | Russian |
| Minimum | 2.6% | 0.81% |
| Maximum | 18.6% | 50.0% |
| Range | 16.0% | 49.2% |
| Mean | 9.1% | 12.1% |
| Median | 8.5% | 7.7% |
| Interquartile 25% (IQ1) | 6.7% | 6.1% |
| Interquartile 75% (IQ3) | 10.9% | 13.3% |
| Interquartile Range (IQR) | 4.2% | 7.2% |
| Standard Deviation (Sample) | 3.4% | 10.8% |
| Standard Deviation (Population) | 3.4% | 10.8% |
Demographics Similar to Koreans and Russians by Male Poverty
In terms of male poverty, the demographic groups most similar to Koreans are Cypriot (9.9%, a difference of 0.10%), Immigrants from Pakistan (9.9%, a difference of 0.18%), Immigrants from Iran (9.9%, a difference of 0.24%), Immigrants from Moldova (9.9%, a difference of 0.50%), and Immigrants from Greece (9.8%, a difference of 0.55%). Similarly, the demographic groups most similar to Russians are Immigrants from Pakistan (9.9%, a difference of 0.010%), Cypriot (9.9%, a difference of 0.080%), Immigrants from Greece (9.8%, a difference of 0.38%), Immigrants from Iran (9.9%, a difference of 0.42%), and Czech (9.8%, a difference of 0.60%).
| Demographics | Rating | Rank | Male Poverty |
| Poles | 99.5 /100 | #30 | Exceptional 9.7% |
| Tongans | 99.5 /100 | #31 | Exceptional 9.7% |
| Macedonians | 99.5 /100 | #32 | Exceptional 9.7% |
| Immigrants | Northern Europe | 99.5 /100 | #33 | Exceptional 9.7% |
| Immigrants | Poland | 99.5 /100 | #34 | Exceptional 9.8% |
| Iranians | 99.4 /100 | #35 | Exceptional 9.8% |
| Czechs | 99.4 /100 | #36 | Exceptional 9.8% |
| Immigrants | Greece | 99.3 /100 | #37 | Exceptional 9.8% |
| Immigrants | Pakistan | 99.2 /100 | #38 | Exceptional 9.9% |
| Russians | 99.2 /100 | #39 | Exceptional 9.9% |
| Cypriots | 99.2 /100 | #40 | Exceptional 9.9% |
| Koreans | 99.2 /100 | #41 | Exceptional 9.9% |
| Immigrants | Iran | 99.1 /100 | #42 | Exceptional 9.9% |
| Immigrants | Moldova | 99.0 /100 | #43 | Exceptional 9.9% |
| Immigrants | Romania | 98.9 /100 | #44 | Exceptional 9.9% |
| Immigrants | Serbia | 98.9 /100 | #45 | Exceptional 10.0% |
| Turks | 98.9 /100 | #46 | Exceptional 10.0% |
| Immigrants | Singapore | 98.8 /100 | #47 | Exceptional 10.0% |
| Immigrants | Japan | 98.8 /100 | #48 | Exceptional 10.0% |
| Slovenes | 98.8 /100 | #49 | Exceptional 10.0% |
| Immigrants | Philippines | 98.7 /100 | #50 | Exceptional 10.0% |