Immigrants from Afghanistan vs Russian Male Poverty
COMPARE
Immigrants from Afghanistan
Russian
Male Poverty
Male Poverty Comparison
Immigrants from Afghanistan
Russians
11.4%
MALE POVERTY
33.3/ 100
METRIC RATING
185th/ 347
METRIC RANK
9.9%
MALE POVERTY
99.2/ 100
METRIC RATING
39th/ 347
METRIC RANK
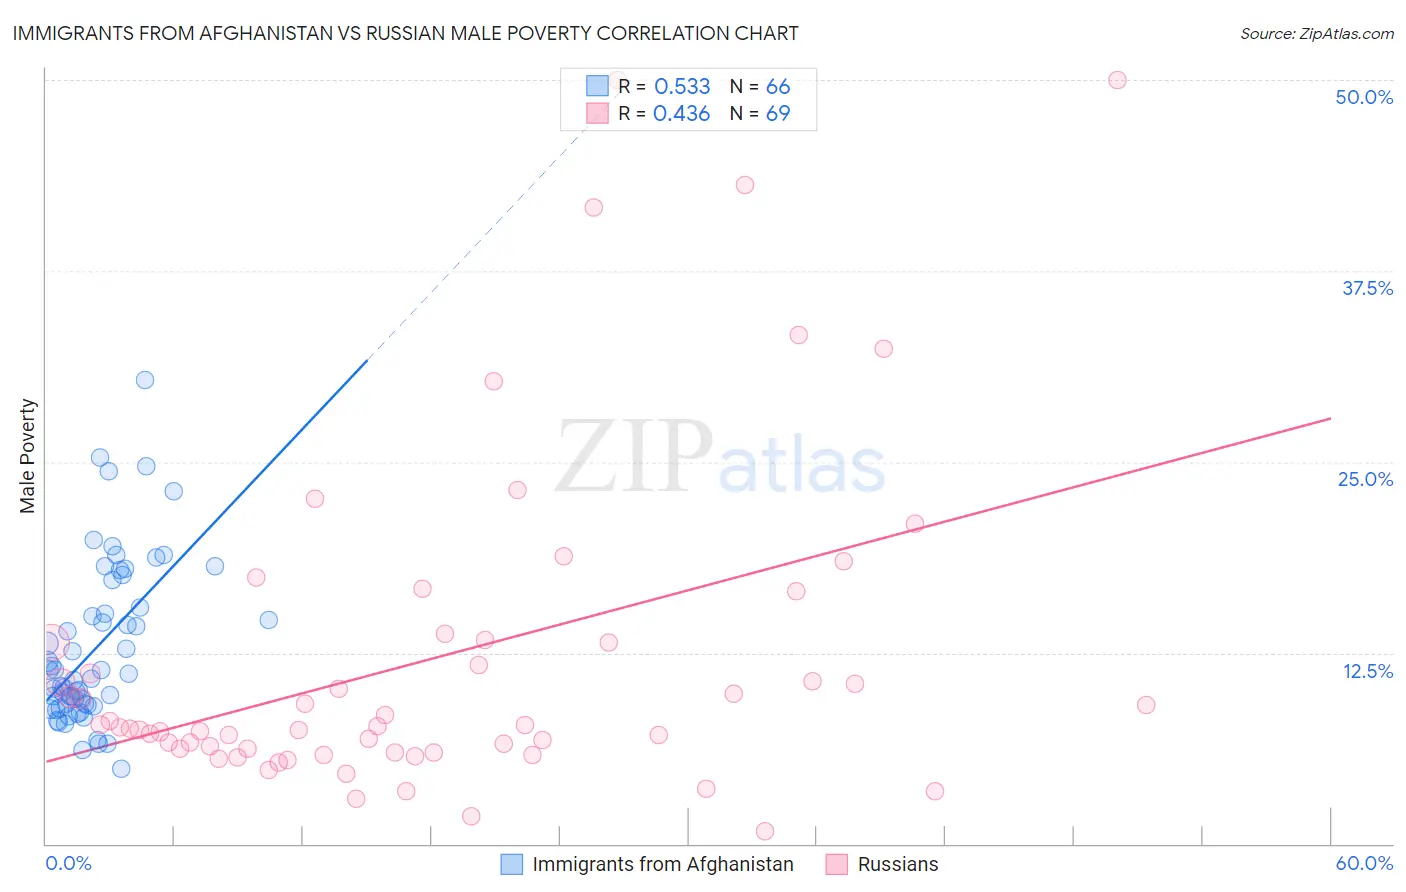
Immigrants from Afghanistan vs Russian Male Poverty Correlation Chart
The statistical analysis conducted on geographies consisting of 147,624,521 people shows a substantial positive correlation between the proportion of Immigrants from Afghanistan and poverty level among males in the United States with a correlation coefficient (R) of 0.533 and weighted average of 11.4%. Similarly, the statistical analysis conducted on geographies consisting of 511,199,815 people shows a moderate positive correlation between the proportion of Russians and poverty level among males in the United States with a correlation coefficient (R) of 0.436 and weighted average of 9.9%, a difference of 15.4%.
Male Poverty Correlation Summary
| Measurement | Immigrants from Afghanistan | Russian |
| Minimum | 4.9% | 0.81% |
| Maximum | 30.4% | 50.0% |
| Range | 25.5% | 49.2% |
| Mean | 12.8% | 12.1% |
| Median | 11.0% | 7.7% |
| Interquartile 25% (IQ1) | 9.1% | 6.1% |
| Interquartile 75% (IQ3) | 15.5% | 13.3% |
| Interquartile Range (IQR) | 6.4% | 7.2% |
| Standard Deviation (Sample) | 5.3% | 10.8% |
| Standard Deviation (Population) | 5.3% | 10.8% |
Similar Demographics by Male Poverty
Demographics Similar to Immigrants from Afghanistan by Male Poverty
In terms of male poverty, the demographic groups most similar to Immigrants from Afghanistan are Immigrants from Sierra Leone (11.4%, a difference of 0.050%), Immigrants from Iraq (11.4%, a difference of 0.16%), Immigrants from South America (11.3%, a difference of 0.38%), Sierra Leonean (11.4%, a difference of 0.38%), and Kenyan (11.3%, a difference of 0.54%).
| Demographics | Rating | Rank | Male Poverty |
| Immigrants | Cameroon | 44.5 /100 | #178 | Average 11.2% |
| Immigrants | Syria | 40.3 /100 | #179 | Average 11.3% |
| Immigrants | Morocco | 40.1 /100 | #180 | Average 11.3% |
| Immigrants | Costa Rica | 39.5 /100 | #181 | Fair 11.3% |
| Mongolians | 39.0 /100 | #182 | Fair 11.3% |
| Kenyans | 38.4 /100 | #183 | Fair 11.3% |
| Immigrants | South America | 36.9 /100 | #184 | Fair 11.3% |
| Immigrants | Afghanistan | 33.3 /100 | #185 | Fair 11.4% |
| Immigrants | Sierra Leone | 32.9 /100 | #186 | Fair 11.4% |
| Immigrants | Iraq | 31.9 /100 | #187 | Fair 11.4% |
| Sierra Leoneans | 29.9 /100 | #188 | Fair 11.4% |
| Hawaiians | 28.3 /100 | #189 | Fair 11.4% |
| Israelis | 26.1 /100 | #190 | Fair 11.5% |
| South American Indians | 22.8 /100 | #191 | Fair 11.5% |
| Immigrants | Uruguay | 19.1 /100 | #192 | Poor 11.6% |
Demographics Similar to Russians by Male Poverty
In terms of male poverty, the demographic groups most similar to Russians are Immigrants from Pakistan (9.9%, a difference of 0.010%), Cypriot (9.9%, a difference of 0.080%), Korean (9.9%, a difference of 0.17%), Immigrants from Greece (9.8%, a difference of 0.38%), and Immigrants from Iran (9.9%, a difference of 0.42%).
| Demographics | Rating | Rank | Male Poverty |
| Macedonians | 99.5 /100 | #32 | Exceptional 9.7% |
| Immigrants | Northern Europe | 99.5 /100 | #33 | Exceptional 9.7% |
| Immigrants | Poland | 99.5 /100 | #34 | Exceptional 9.8% |
| Iranians | 99.4 /100 | #35 | Exceptional 9.8% |
| Czechs | 99.4 /100 | #36 | Exceptional 9.8% |
| Immigrants | Greece | 99.3 /100 | #37 | Exceptional 9.8% |
| Immigrants | Pakistan | 99.2 /100 | #38 | Exceptional 9.9% |
| Russians | 99.2 /100 | #39 | Exceptional 9.9% |
| Cypriots | 99.2 /100 | #40 | Exceptional 9.9% |
| Koreans | 99.2 /100 | #41 | Exceptional 9.9% |
| Immigrants | Iran | 99.1 /100 | #42 | Exceptional 9.9% |
| Immigrants | Moldova | 99.0 /100 | #43 | Exceptional 9.9% |
| Immigrants | Romania | 98.9 /100 | #44 | Exceptional 9.9% |
| Immigrants | Serbia | 98.9 /100 | #45 | Exceptional 10.0% |
| Turks | 98.9 /100 | #46 | Exceptional 10.0% |