Immigrants from Argentina vs White/Caucasian Child Poverty Among Girls Under 16
COMPARE
Immigrants from Argentina
White/Caucasian
Child Poverty Among Girls Under 16
Child Poverty Among Girls Under 16 Comparison
Immigrants from Argentina
Whites/Caucasians
14.6%
CHILD POVERTY AMONG GIRLS UNDER 16
98.3/ 100
METRIC RATING
68th/ 347
METRIC RANK
16.6%
CHILD POVERTY AMONG GIRLS UNDER 16
43.6/ 100
METRIC RATING
178th/ 347
METRIC RANK
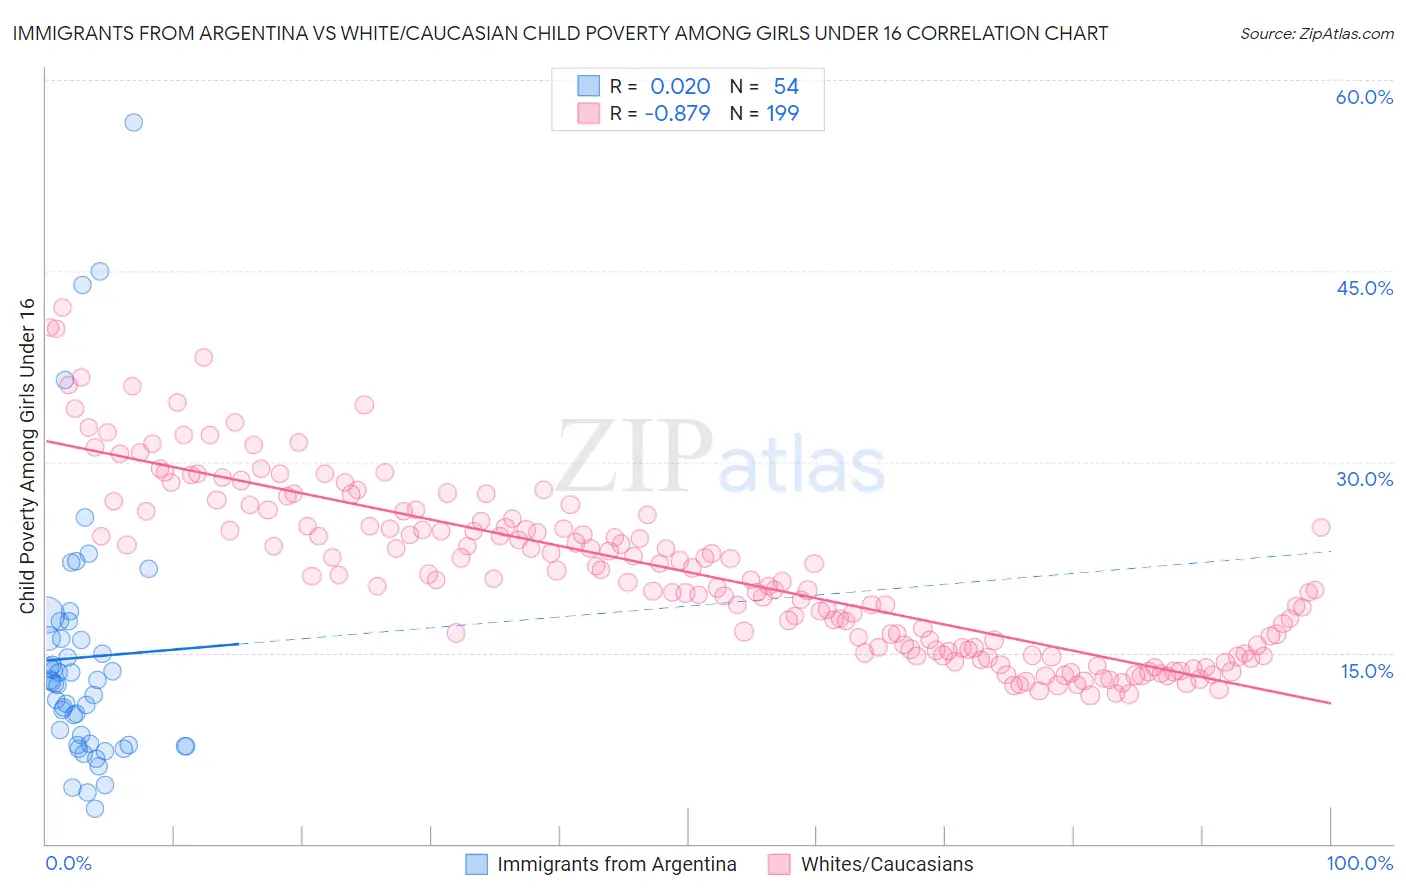
Immigrants from Argentina vs White/Caucasian Child Poverty Among Girls Under 16 Correlation Chart
The statistical analysis conducted on geographies consisting of 261,133,430 people shows no correlation between the proportion of Immigrants from Argentina and poverty level among girls under the age of 16 in the United States with a correlation coefficient (R) of 0.020 and weighted average of 14.6%. Similarly, the statistical analysis conducted on geographies consisting of 558,680,954 people shows a very strong negative correlation between the proportion of Whites/Caucasians and poverty level among girls under the age of 16 in the United States with a correlation coefficient (R) of -0.879 and weighted average of 16.6%, a difference of 14.0%.
Child Poverty Among Girls Under 16 Correlation Summary
| Measurement | Immigrants from Argentina | White/Caucasian |
| Minimum | 2.8% | 11.7% |
| Maximum | 56.7% | 42.2% |
| Range | 53.9% | 30.5% |
| Mean | 14.6% | 21.4% |
| Median | 12.6% | 20.7% |
| Interquartile 25% (IQ1) | 7.8% | 15.2% |
| Interquartile 75% (IQ3) | 16.1% | 25.5% |
| Interquartile Range (IQR) | 8.4% | 10.3% |
| Standard Deviation (Sample) | 10.3% | 6.8% |
| Standard Deviation (Population) | 10.3% | 6.7% |
Similar Demographics by Child Poverty Among Girls Under 16
Demographics Similar to Immigrants from Argentina by Child Poverty Among Girls Under 16
In terms of child poverty among girls under 16, the demographic groups most similar to Immigrants from Argentina are Laotian (14.5%, a difference of 0.15%), Immigrants from Poland (14.6%, a difference of 0.16%), European (14.6%, a difference of 0.28%), Slovene (14.6%, a difference of 0.32%), and Immigrants from Netherlands (14.6%, a difference of 0.34%).
| Demographics | Rating | Rank | Child Poverty Among Girls Under 16 |
| Cambodians | 98.7 /100 | #61 | Exceptional 14.4% |
| Scandinavians | 98.7 /100 | #62 | Exceptional 14.4% |
| Immigrants | Europe | 98.7 /100 | #63 | Exceptional 14.4% |
| Immigrants | Philippines | 98.6 /100 | #64 | Exceptional 14.4% |
| Immigrants | Sweden | 98.6 /100 | #65 | Exceptional 14.5% |
| Immigrants | Belgium | 98.5 /100 | #66 | Exceptional 14.5% |
| Laotians | 98.4 /100 | #67 | Exceptional 14.5% |
| Immigrants | Argentina | 98.3 /100 | #68 | Exceptional 14.6% |
| Immigrants | Poland | 98.2 /100 | #69 | Exceptional 14.6% |
| Europeans | 98.1 /100 | #70 | Exceptional 14.6% |
| Slovenes | 98.1 /100 | #71 | Exceptional 14.6% |
| Immigrants | Netherlands | 98.1 /100 | #72 | Exceptional 14.6% |
| Immigrants | Austria | 98.0 /100 | #73 | Exceptional 14.6% |
| Taiwanese | 98.0 /100 | #74 | Exceptional 14.6% |
| Immigrants | Eastern Europe | 98.0 /100 | #75 | Exceptional 14.6% |
Demographics Similar to Whites/Caucasians by Child Poverty Among Girls Under 16
In terms of child poverty among girls under 16, the demographic groups most similar to Whites/Caucasians are Hawaiian (16.6%, a difference of 0.030%), Immigrants from Syria (16.6%, a difference of 0.040%), Immigrants from Western Asia (16.6%, a difference of 0.060%), Immigrants from Iraq (16.6%, a difference of 0.060%), and Immigrants from Ethiopia (16.6%, a difference of 0.070%).
| Demographics | Rating | Rank | Child Poverty Among Girls Under 16 |
| Immigrants | Saudi Arabia | 64.0 /100 | #171 | Good 16.2% |
| Afghans | 62.3 /100 | #172 | Good 16.2% |
| Immigrants | South America | 55.1 /100 | #173 | Average 16.4% |
| Ethiopians | 50.0 /100 | #174 | Average 16.5% |
| Lebanese | 45.4 /100 | #175 | Average 16.6% |
| Hungarians | 45.1 /100 | #176 | Average 16.6% |
| Immigrants | Western Asia | 44.1 /100 | #177 | Average 16.6% |
| Whites/Caucasians | 43.6 /100 | #178 | Average 16.6% |
| Hawaiians | 43.4 /100 | #179 | Average 16.6% |
| Immigrants | Syria | 43.3 /100 | #180 | Average 16.6% |
| Immigrants | Iraq | 43.2 /100 | #181 | Average 16.6% |
| Immigrants | Ethiopia | 43.1 /100 | #182 | Average 16.6% |
| Immigrants | Portugal | 42.5 /100 | #183 | Average 16.6% |
| Scotch-Irish | 39.6 /100 | #184 | Fair 16.7% |
| Immigrants | Uruguay | 35.6 /100 | #185 | Fair 16.7% |