Immigrants from Lebanon vs White/Caucasian Child Poverty Among Girls Under 16
COMPARE
Immigrants from Lebanon
White/Caucasian
Child Poverty Among Girls Under 16
Child Poverty Among Girls Under 16 Comparison
Immigrants from Lebanon
Whites/Caucasians
17.1%
CHILD POVERTY AMONG GIRLS UNDER 16
22.6/ 100
METRIC RATING
198th/ 347
METRIC RANK
16.6%
CHILD POVERTY AMONG GIRLS UNDER 16
43.6/ 100
METRIC RATING
178th/ 347
METRIC RANK
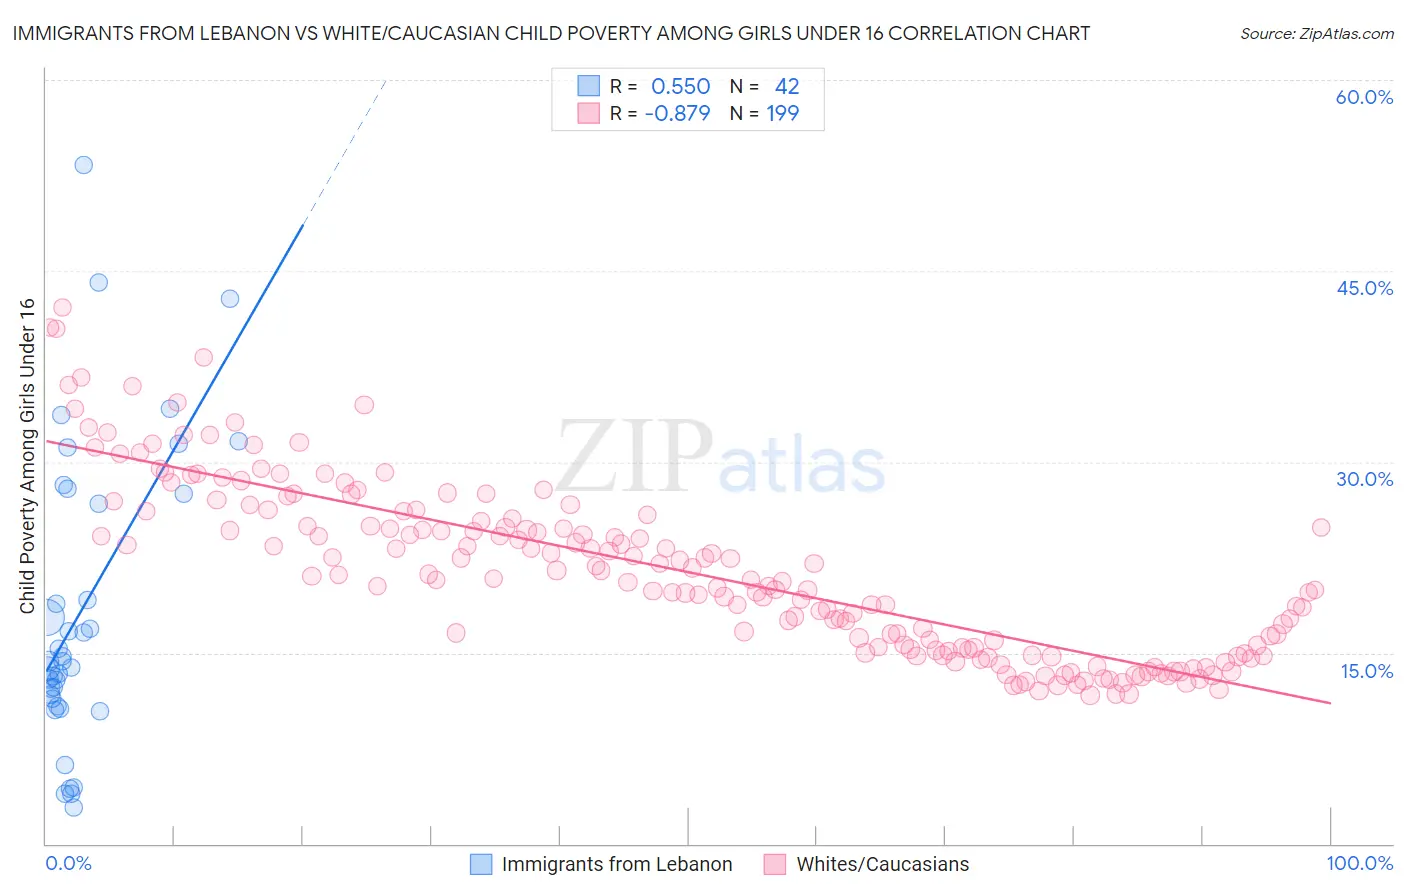
Immigrants from Lebanon vs White/Caucasian Child Poverty Among Girls Under 16 Correlation Chart
The statistical analysis conducted on geographies consisting of 214,720,358 people shows a substantial positive correlation between the proportion of Immigrants from Lebanon and poverty level among girls under the age of 16 in the United States with a correlation coefficient (R) of 0.550 and weighted average of 17.1%. Similarly, the statistical analysis conducted on geographies consisting of 558,680,954 people shows a very strong negative correlation between the proportion of Whites/Caucasians and poverty level among girls under the age of 16 in the United States with a correlation coefficient (R) of -0.879 and weighted average of 16.6%, a difference of 2.8%.
Child Poverty Among Girls Under 16 Correlation Summary
| Measurement | Immigrants from Lebanon | White/Caucasian |
| Minimum | 2.9% | 11.7% |
| Maximum | 53.3% | 42.2% |
| Range | 50.5% | 30.5% |
| Mean | 18.4% | 21.4% |
| Median | 14.3% | 20.7% |
| Interquartile 25% (IQ1) | 11.4% | 15.2% |
| Interquartile 75% (IQ3) | 27.5% | 25.5% |
| Interquartile Range (IQR) | 16.1% | 10.3% |
| Standard Deviation (Sample) | 11.7% | 6.8% |
| Standard Deviation (Population) | 11.6% | 6.7% |
Demographics Similar to Immigrants from Lebanon and Whites/Caucasians by Child Poverty Among Girls Under 16
In terms of child poverty among girls under 16, the demographic groups most similar to Immigrants from Lebanon are Spaniard (17.0%, a difference of 0.35%), Celtic (17.0%, a difference of 0.41%), Immigrants from Costa Rica (17.0%, a difference of 0.46%), Spanish (16.9%, a difference of 0.89%), and Aleut (16.9%, a difference of 0.90%). Similarly, the demographic groups most similar to Whites/Caucasians are Hawaiian (16.6%, a difference of 0.030%), Immigrants from Syria (16.6%, a difference of 0.040%), Immigrants from Iraq (16.6%, a difference of 0.060%), Immigrants from Ethiopia (16.6%, a difference of 0.070%), and Immigrants from Portugal (16.6%, a difference of 0.14%).
| Demographics | Rating | Rank | Child Poverty Among Girls Under 16 |
| Whites/Caucasians | 43.6 /100 | #178 | Average 16.6% |
| Hawaiians | 43.4 /100 | #179 | Average 16.6% |
| Immigrants | Syria | 43.3 /100 | #180 | Average 16.6% |
| Immigrants | Iraq | 43.2 /100 | #181 | Average 16.6% |
| Immigrants | Ethiopia | 43.1 /100 | #182 | Average 16.6% |
| Immigrants | Portugal | 42.5 /100 | #183 | Average 16.6% |
| Scotch-Irish | 39.6 /100 | #184 | Fair 16.7% |
| Immigrants | Uruguay | 35.6 /100 | #185 | Fair 16.7% |
| South American Indians | 35.0 /100 | #186 | Fair 16.8% |
| Immigrants | Morocco | 34.6 /100 | #187 | Fair 16.8% |
| Arabs | 34.5 /100 | #188 | Fair 16.8% |
| Immigrants | Bosnia and Herzegovina | 32.5 /100 | #189 | Fair 16.8% |
| Kenyans | 32.3 /100 | #190 | Fair 16.8% |
| Immigrants | Azores | 31.3 /100 | #191 | Fair 16.8% |
| Immigrants | Uganda | 31.3 /100 | #192 | Fair 16.8% |
| Aleuts | 28.7 /100 | #193 | Fair 16.9% |
| Spanish | 28.6 /100 | #194 | Fair 16.9% |
| Immigrants | Costa Rica | 25.6 /100 | #195 | Fair 17.0% |
| Celtics | 25.2 /100 | #196 | Fair 17.0% |
| Spaniards | 24.9 /100 | #197 | Fair 17.0% |
| Immigrants | Lebanon | 22.6 /100 | #198 | Fair 17.1% |